Clearly short of something to say after the almighty media circus generated by the climate change hotspots publication, our friend Andy Jarvis is reduced to celebrating an embarassingly artificial milestone on the DAPA blog today. Normally I would treat such awkward space filling with the contempt it deserves, but today I’m in the mood to, well, fill space. So here goes.
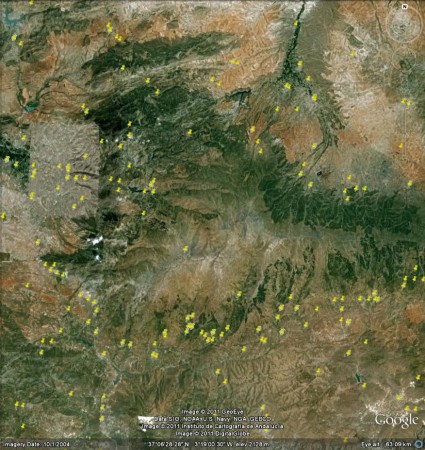
Andy’s post is about the 90m-resolution digital elevation dataset he and his colleagues have been working on for ages. The milestone he trumpets is 750,000 visitors, but more important is the fact that the data is now visible in Google Earth, which I didn’t know. Here’s what a bit of Spain looks like with the normal Google Earth imagery, the records on show being from Genesys. ((BTW, thanks to Google for the Google Earth license.))

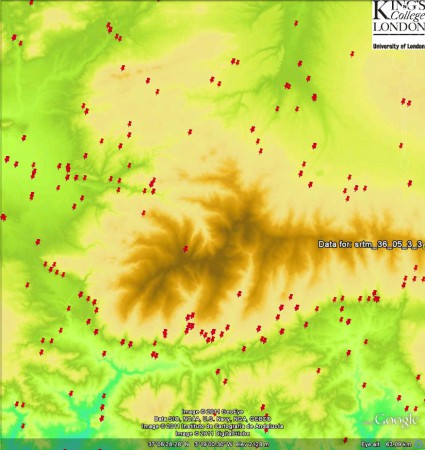
And this is what the same area looks like using the SRTM data:

Advantages to both, I suppose, from a purely aesthetic point of view.
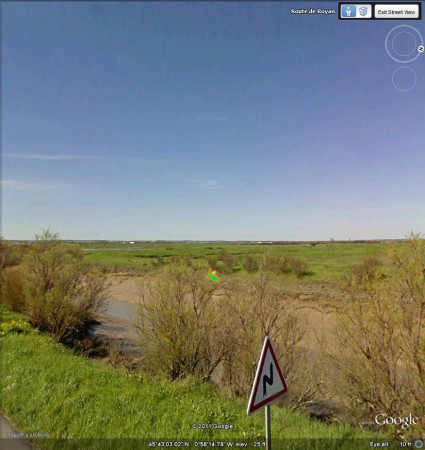
Incidentally, some further playing around with Google Earth revealed a couple of collecting localities for Beta maritima (from GBIF this time) that are easily visible in Street View. Here’s an example, featuring a record from France’s Inventaire national du Patrimoine naturel (INPN), catalogue number INPN_21204166 in case you’re interested. ((Their website is worth exploring. If you do, you’ll find out, among other things, that Beta maritima, is found near the sea significantly more frequently than the average French plant. Unfortunately, the nifty plots and maps are not easily downloadable.))
