There’s a lot that’s both nice and deliciously ironic about IFPRI’s recent blog post “Granular socioeconomic data are increasingly becoming available in agricultural research.” This summarizes a letter to Nature Climate Change from HarvestChoice scientists which adds some nuance to a previous commentary in that journal calling on socioeconomists to up their data game. The point is a good one, and it’s stated right up front in the post, quoting the letter:
Spatially explicit, harmonized socio-economic data products are increasingly available to the public, such as population and poverty grids, microdata derived from national household surveys, and rasterized sociodemographic indicators. While these products are often overlooked in the economic literature, they are well suited to the study of climate’s impact on human geography across scales.
But, then comes the irony.
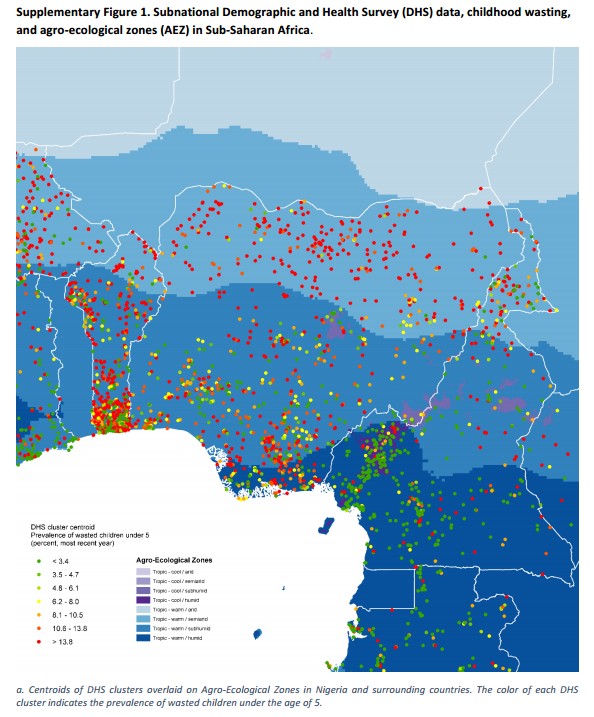
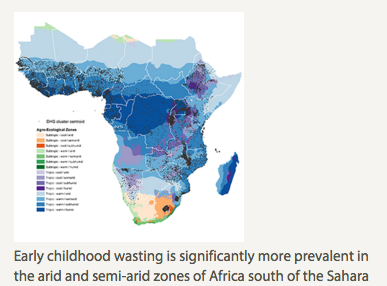 First, both the letter and the original article, helpfully linked to in the blog post, are of course behind paywalls. Second, the map included in the post is provided with an incorrect caption. There’s a screen grab here on the left. As you can see, the caption suggests that the map illustrates that childhood wasting is more prevalent in the drier areas of sub-Saharan Africa. But the map shows no such thing, as a glance at the legend, or indeed the map in the original letter, will prove. What the map caption should actually be is “Subnational Demographic and Health Surveys (DHS) data showing centroids of DHS clusters overlaid on Agro-ecological Zones.” Not quite so catchy. The map showing the relationship between wasting and agroecological zones is this one, and it’s in the Supplementary Materials to the letter. ((Which, bizarrely, seem to be freely available.)) I hope I don’t get into trouble for reproducing it here, but it is pretty cool.
And thirdly, and most importantly, frankly neither the socioeconomic datasets nor the agroecological map which the HarvestChoice researchers cleverly mashed up to make their point about data availability are exactly easy for the average non-GIS geek to use, let alone to combine. Try it and see.
The original paper calls for a “new paradigm in data gathering.” The blog post echoes the follow-up letter in saying “the paradigm shift is alive and kicking already.” Oh good. But I’d like to be able to look at the distribution of stunting and other nutritional indicators together with the distribution of different crops and varieties without having to beg a GIS person to do it for me, or spending half a day putzing around trying to understand what this means
Data layers are available in comma-separated values format (.csv) suitable for MSExcel, in ESRI ASCII Raster (.asc) and GeoTIFF formats (.tif) suitable for any desktop GIS tool. To view ASCII or GeoTIFF rasters in ArcMap or QuantumGIS simply drag and drop the downloaded files onto the layer pane.
Sure, have your paradigm shift in data gathering. But can I also have one in usability, please?
Thanks, Luigi, for your comments. Good insights indeed.
No doubt about that. Clearly, although we use open-source data, if you aren’t trained in ‘advanced data gathering’, these kind of analyses aren’t exactly accessible. That’s one reason behind our statement: “While these products are often overlooked in the economic literature, they are well suited to the study of climate’s impact on human geography across scales.”
One of HarvestChoice’s primary objectives involves extracting agricultural data (from bottom up to top down) from sub-Saharan Africa region into a singular, spatially-explicit, harmonized database (The Cell5M) openly available to the public so others don’t have to do all the “putzing around”. Additionally, we do provide more user-friendly tools to tap into the core of our data holdings (for example, Mappr and Tablr) on our website. This is not to say we are not continually evolving our platform to reach more users and fine-tuning our holdings, as well as providing analyses to development practitioners ourselves.
Although a new generation of development practitioners and analysts are increasingly taking advantage of so-called alternative data sources like we used in our paper, such resources are still underutilized in socio-economics. And without a story, data are meaningless.
Finally, if you would like to see the article in full, please email us and we can send a copy (you can also email: c.cox@cgiar.org). Unlike the data, the article is not open-access. Ironic indeed!
Cheers!
Cindy Cox on behalf of HarvestChoice