Over at the work blog, I’m busy jumping on the biodiversity mainstreaming bandwagon, but I wrote that piece before news came out this morning from the Convention on Biological Diversity meeting in Cancun of the disappointing lack of progress around the world in meeting the Aichi Targets.
You remember the Aichi Targets, don’t you? We’re supposed to be doing a lot of good things for biodiversity by 2020, including, in Target 13, for agro-biodiversity:
the genetic diversity of cultivated plants and farmed and domesticated animals and of wild relatives, including other socio-economically as well as culturally valuable species, is maintained, and strategies have been developed and implemented for minimizing genetic erosion and safeguarding their genetic diversity.
Here’s how we’re getting on, according to the just-published assessment. Spoiler alert: not very well. Green means “On track to meet or exceed the Aichi Target,” orange is “Progress to achieve the Aichi Target but at insufficient rate,” and red denotes “No progress, or a decline against the Aichi Target.” And remember that not all national targets are necessarily well aligned with the Aichi targets, for Target 13 75% being less ambitious or poorly aligned.
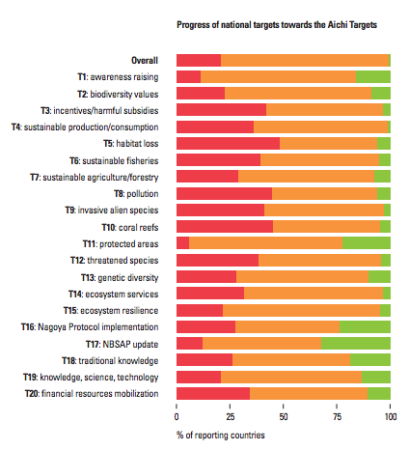
The assessment summarizes how countries say they’re doing. Or rather, how the CBD interprets how countries say they’re doing, in meeting the different targets:
101 parties submitted their National Biodiversity Strategy and Action Plans (NBSAPs) and 5th National Reports between 2011 and 2016. As of July 2016, 5th National Reports have been submitted by 90% of the Parties, and NBSAPs by 52%. These were collated, analysed and scored by the CBD Secretariat (SCBD).
Here’s the raw data, if you’re interested. How does Venezuela, say, know that it is “on track to achieve” Target 13? There are lots of possible indicators out there. The CBD itself suggested a couple early on in its “quick guide” to Target 13:
• Trends in genetic diversity of cultivated plants, and farmed and domesticated animals and their wild relatives
• Trends in genetic diversity of selected species
• Trends in number of effective policy mechanisms implemented to reduce genetic erosion and safeguard genetic diversity related to plant and animal genetic resources
And a little later, in 2016, in the 5th edition of the Global Biodiversity Outlook, National Reporting and Indicators for Assessing Progress towards the Aichi Biodiversity Targets (UNEP/CBD/SBSTTA/20/13), it came up with this little lot (click to read better):
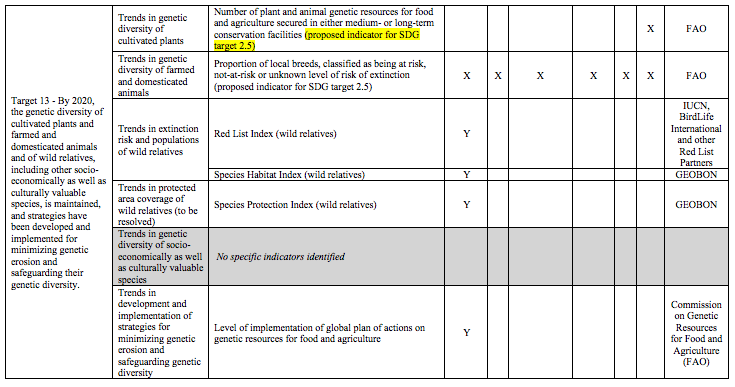
Note that a couple of indicators (number of accessions in genebanks, number of livestock breeds at risk) are also being proposed for SDG Target 2.5, which echoes the wording of Aichi 13. Note also that, as we blogged about yesterday, some progress is being made on the indicator on Red Listing crop wild relatives. And finally, the Commission on Genetic Resources for Food and Agriculture did come up with a very thorough assessment of global plans of action for plant genetic resources earlier this year.
But it’s not over, not by a long chalk. The Biodiversity Indicator Partnership seems to have ideas of its own (though it likes the breeds indicator)…
• Proportion of local breeds classified as being at risk, not-at-risk or at unknown level of risk of extinction
• Growth in species occurrence records accessible through GBIF
and it wants to hear from you if you’ve got better ones.
They may well hear from me eventually, because we’ve been thinking about this whole indicator thing at work too. Stay tuned… In the meantime, I don’t know which specific indicator(s) Venezuela (or any other country) used, I’m afraid. I’d have to look at its NBSAP, and maybe I will one day. Or more likely, get an intern to do it. But if we take the CBD assessment at face value, and it’s the best we have at the moment, we do have some work to do on Target 13. 2020 is not that far away. Lots more mainstreaming to do.
On page 76 of the assessment, in Table 19, there is a metric for
“Web pages”. This comes under the impetus to generate (or raise) public awareness. My question – do you have any idea whether ABW is counted as a web page for this survey?