- Assessment of genetic relationships between cultivated arracacha (Arracacia xanthorrhiza Bancr.) and its wild close relatives in the area of domestication using microsatellite markers. Lots more variation in the wild, natch.
- Exploring Relationships between Biodiversity and Dietary Diversity in the Mediterranean Region: Preliminary Insights from a Literature Review. There has been an increase in dietary diversity, but of the wrong sort of diversity.
- Special issue Of Small Ruminant Research on “Genetic diversity of small ruminants in Asia”. From the Punjab Urial sheep to the goats of Myanmar.
- Genetic diversity of flax accessions originating in the Alpine region: a case study for an ex situ germplasm evaluation based on molecular marker. Past genebank conservation hasn’t been perfect.
- Enhancing genetic gain in the era of molecular breeding. It all starts with genetic variance. Hello, genebanks!
- Crops In Silico: Generating Virtual Crops Using an Integrative and Multi-scale Modeling Platform. Factor in gene editing and goodbye genebanks.
- Unconscious selection drove seed enlargement in vegetable crops. And not only vegetables, cereals too. But remember African rice?
- Palm economic and traditional uses, evolutionary history and the IUCN Red List. Globally, the more threatened palms are the less used.
- Impact of Climate Change, Weather Extremes, and Price Risk on Global Food Supply. The effect is not just on production, but also price.
- Identifying the landscape drivers of agricultural insecticide use leveraging evidence from 100,000 fields. In Kern County, California, crop diversity decreases insecticide us. But…
Brainfood: CWR prioritization, CWR data, Yam core redux, Traditional landscape value, African rice domestication, Digital conservation, First farmers, Revived breed, Mitigation targets, Zoonoses, Population, JEB on legumes
- Broadening the Base, Narrowing the Task: Prioritizing Crop Wild Relative Taxa for Conservation Action. Use socioeconomic value of crop, and potential usefulness and threat status of relative.
- Germinate 3: Development of a Common Platform to Support the Distribution of Experimental Data on Crop Wild Relatives. Useful in determining the second of the above.
- Re-defining the yam (Dioscorea spp.) core collection using morphological traits. Cleaning up the core.
- “Things are different now”: Farmer perceptions of cultural ecosystem services of traditional rice landscapes in Vietnam and the Philippines. 73 indicators for the contribution of landscapes to culture, aesthetics, and local knowledge.
- A single-nucleotide polymorphism causes smaller grain size and loss of seed shattering during African rice domestication. You want no shattering? You also get smaller seeds. Like it or edit it.
- Digital conservation: An introduction. Brave new world… Special issue of Ambio.
- The Genomic History Of Southeastern Europe. Souther Greek Neolithic farmers not same as other European Neolithic farmers.
- Genomics of a revived breed: Case study of the Belgian campine cattle. Racial impurities are confined to a few farms.
- Reducing emissions from agriculture to meet the 2 °C target. We’re doomed.
- Conservation of biodiversity as a strategy for improving human health and well-being. By keeping animals and their nasty diseases away from people, we’re not talking communing with Nature here.
- The interaction of human population, food production, and biodiversity protection. Minimise the interaction.
- Nature’s pulse power: legumes, food security and climate change. Special issue of Journal of Experimental Botany on legumes. Eat up your beans!
Complementarity between informal and formal seed systems
The webinar. Today. Register quick.
Complementarity between the informal and formal seed systems will be approached in a holistic way through this webinar. Not only do the conservation and innovation systems need to integrate the formal and informal seed systems to benefit from one another’s capacity and value added, but new policies and legal measures need to be formulated to ensure the recognition and implementation of the rights of farmers.
Building the SDGs on dodgy premises
A couple of things on the SDGs today for you to wade through.
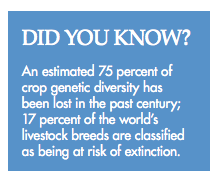 First, from FAO, there’s “FAO and the SDGs — Indicators: Measuring up to the 2030 Agenda for Sustainable Development.” There’s a lot of sensible stuff in there on how to measure progress towards the SDG targets, goal by goal. I’m afraid, however, it lost me with the little sidebar I reproduce here. No, I didn’t know that. Mainly because that first bit is not true.
And then there’s an IIED Briefing on SDG2 in particular — that’s the hunger one. Surely they’ll stay away from dodgy numbers. Nope.
Genetic diversity reduces risk in agricultural systems and allows farmers to adapt to a changing environment, yet an estimated 75 per cent of crop diversity was lost between 1900 and 2000 with local varieties replaced by modern ones.
The reference? FAO’s training manual on Building on Gender, Agrobiodiversity and Local Knowledge. Where there is this:
But also this:
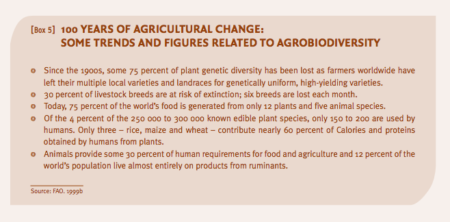
More than 90 percent of crop varieties have disappeared from farmers’ fields; half of the breeds of many domestic animals have been lost. In fisheries, all the world’s 17 main fishing grounds are now being fished at or above their sustainable limits, with many fish populations effectively becoming extinct. Loss of forest cover, coastal wetlands, other ‘wild’ uncultivated areas, and the destruction of the aquatic environment exacerbate the genetic erosion of agrobiodiversity.
Which is a bit confusing. The reference for that box? This. From 1999.
Oh well.
Brainfood: Iron beans, Citrus evolution, Ethiopian co-ops, Farmer evaluation app, Exotic breeding, Cost of doing business, Plummy, Italian pears, Chinese cowpea, Breadfruit phylogeny, Seed collecting
- Iron beans in Rwanda: crop development and delivery experience. 800,000 households, discontinuation rate 11%. But the health outcomes? Too early, I guess.
- Phylogenetic origin of limes and lemons revealed by cytoplasmic and nuclear markers. It’s so VERY complicated.
- Seed producer cooperatives in the Ethiopian seed sector and their role in seed supply improvement: A review. Sitting between the formal and informal seed systems, they “play a key role in meeting seed demand and contribute greatly to seed supply improvement through high-volume production of seed, crop, and variety diversification, and seed delivery to farmers.”
- Gamification of farmer-participatory priority setting in plant breeding: Design and validation of “AgroDuos”. Based on pairwise ranking. I remember doing it by hand, but it’s nice to have the app. And there’s more.
- Emerging Avenues for Utilization of Exotic Germplasm. It comes down to the collections being better characterized and understood.
- Genetic resource policies in international collaborative research for food and agriculture: A study of USAID-funded innovation labs. Transaction costs are rising. Well, yeah.
- Plums: A Brief Introduction. Will keep you regular.
- Characterization and phylogenetic analysis of ancient Italian landraces of pear. Some synonyms found, some unknown things identified. All very worthy.
- Genetic diversity and a population structure analysis of accessions in the Chinese cowpea [Vigna unguiculata (L.) Walp.] germplasm collection. The Chinese stuff is different to the African stuff.
- Out of Borneo: biogeography, phylogeny and divergence date estimates of Artocarpus (Moraceae). Yeah but how many can you eat?
- Effective seed harvesting strategies for the ex situ genetic diversity conservation of rare tropical tree populations. “…fewer seeds from each of a larger number of trees, … from peripheral subdivided regions of the population.”