Is “slash and burn” – swidden agriculture – a good or a bad thing? That’s when farmers cut down an area of forest (though often leaving the larger trees standing), burn the cut vegetation, and plant their crops, often roots and tubers, in the resulting ashy soil for a few years. When the soil is exhausted, they move on to another patch of forest, leaving the first one to grow back, ideally for perhaps 20 years or more, before being used again. A recent article from a local newspaper in the Philippines makes this sound like something to be guarded against at all costs, but can a practice with a track record of sustainable management of agricultural biodiversity and other natural resources in various parts of the world stretching back thousands of years really be all that bad? Although there is always room for improvement, surely the problem does not rest with slash and burn itself so much as with what happens when the system goes wrong because of over-intensification and excessive shortening of fallows. That should have been explained in the article. I hope it was explained to the people who, according to the article, were forcibly prevented from carrying out their traditional agriculture. When forest conservation and farming livelihoods come into conflict in this heavy-handed way there can be no winners.
Traditional farming in Spain … and elsewhere
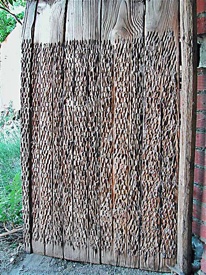 National Geographic has a fine feature called Photo of the Day. Today’s shows a Spanish farmer with a wooden, sled-like contraption with sharp rocks embedded in the bottom. It’s a threshing board, used at harvest time to cut up straw, separate cereal grains from chaff and break open chickpea pods. Now, unfortunately I can’t just take the NatGeo photo and put it up here for you to see, you’ll just have to go to their site, but I did look around for an illustration that was in the public domain, and I found it at Answers.com, in a fascinating article on the history of these tools. The NatGeo photo is worth seeing, though. While surfing, I also ended up at the Food Museum Online, which I’d never come across before. It’s not the prettiest looking site, but it has some great content, including illustrations of traditional farming practices and tools. There’s also a blog, with a feed.
Photo of a Spanish “trillo” by José-Manuel Benito
Tropical Europe
It is easy to forget that Europe – at least political Europe, if not geographical Europe – includes some sub-tropical and tropical areas, ranging from the Azores to French Guyana. Now there’s a project which tries to bring some of these territories together “to identify common challenges” in biodiversity conservation and “tackle them in a coordinated way.” It is called NET-BIOME (NETworking tropical and subtropical Biodiversity research in OuterMost regions and territories of Europe in support of sustainable development). I know what you’re thinking: will it address agricultural biodiversity? Difficult to say from the information I’ve been able to find on it, but needless to say I for one think it should!
Cassava in Africa
Cassava has a big problem in Africa, and it is called brown streak virus. A virulent strain is spreading rapidly across eastern and southern Africa from a beachhead in Zanzibar, devastating the tubers but leaving the leaves looking healthy, which means farmers don’t realize anything is wrong until it is too late. Scientists from the International Institute for Tropical Agriculture (IITA) have been studying the virus and have developed resistant varieties, by conventional breeding, and these are finding their way to farmers.
There’s a short SciDev piece about brown streak virus which points to a longer, very readable New Scientist article. I know we’re talking about a very serious problem and a very nice solution based on the exploitation of agricultural biodiversity, but normally I wouldn’t blog about this sort of thing, simply because there are so many similar examples out there. But I was inspired to do so on this occasion because I also spotted an article in a Ugandan newspaper (via the wonderful allAfrica.com) which talks about the resistant varieties and efforts to get sufficient planting material of these cultivars into the hands of farmers in a particular district. It’s always nice to see “big” stories from international news sources reflected in the local media.
Cassava is an important constituent of Kinshasa’s urban gardens, whose role in providing nutrition, especially to children, is so well described in a Christian Science Monitor article today. Let’s hope brown streak virus doesn’t reach Kinshasa, but if it does the resistant varieties would find a ready means of dissemination through a project which “organized a team of local volunteers called “Mama Bongisa” (‘mom improver’) to teach mothers in some … impoverished neighborhoods about nutrition and farming.”
Livestock and carnivores
In many parts of Africa, carnivores such as lions and wild dogs still come into frequent conflict with pastoralist communities such as the Maasai because of their attacks on their cattle and goats. This naturally results in a tension between the aims – and indeed the practitioners – of wildlife conservation and of rural development that does no good to either camp. So it is interesting to read of a study which looked at how to foster co-existence between people, domesticated animals, and large predators. The paper identifies improvements to traditional livestock management, as well as other measures, that can contribute to wild carnivore conservation by minimizing the risk to livestock.