- The Value of Biodiversity as an Insurance Device. So apparently the “Epstein-Zin-Weil specification of the utility function allows us to disentangle the effects of risk aversion and aversion to fluctuations.” Good to know.
- The Invasive Legacy of Forage Grass Introductions into Florida. Sometimes biodiversity is bad for you, Epstein-Zin-Weil specification or not.
- Cultigen Chenopods in the Americas: A Hemispherical Perspective. Why did the North American one not do a quinoa?
- The potential of landscape genomics approach in the characterization of adaptive genetic diversity in indigenous goat genetic resources: A South African perspective. “[N]on-descript indigenous veld goats” no longer.
- Collection and characterization of grapevine genetic resources (Vitis vinifera) in the Holy Land, towards the renewal of ancient winemaking practices. Some of the local varieties could make a decent tipple.
- Genetic studies regarding the control of seed pigmentation of an ancient European pointed maize (Zea mays L.) rich in phlobaphenes: the “Nero Spinoso” from the Camonica valley. But do we really want to promote a landrace as a functional food?
- Genetic diversity patterns in ex situ collections of Oryza officinalis Wall. ex G. Watt revealed by morphological and microsatellite markers. Malesia separates out from SE Asia, and similarities between PNG and Philippines points to long-distance dispersal by birds. Or germplasm collectors.
- Perceptual selection and the unconscious selection of ‘volunteer’ seedlings in clonally propagated crops: an example with African cassava (Manihot esculenta Crantz) using ethnobotany and population genetics. Occasional seedlings are allowed to survive not so much because they look different, but because they look similar, to existing landraces, even though they may be genetically distinct.
- Evolutionary “Bet-Hedgers” under Cultivation: Investigating the Domestication of Erect Knotweed (Polygonum erectum L.) using Growth Experiments. Experimental domestication pretty quickly gets rid of that peskily bet-hedging germination heteromorphism.
- Are We Getting Better at Using Wild Potato Species in Light of New Tools? Not until we move on from conserving populations and start documenting individual plants in depth.
- Crucible of Crop Diversity: Forging Partnership with Farmer Breeders and Innovators for Higher Climate Resilience. Experience of the Honey Bee Network in bringing together farmers and researchers.
- Understanding the genetic diversity and population structure of yam (Dioscorea alata L.) using microsatellite markers. 17 groups among 384 global accessions, reflecting geography, ploidy and morpho-agronomy.
- Harnessing diversity from ecosystems to crops to genes. “…currently, approximately 75% of the genetic diversity of crops may have been lost.” I do like that “may.”
- Multivariate analysis of morphological diversity among closely related Daucus species and subspecies in Tunisia. The revenge of morphology: D. sahariensis, plus 4 subspecies of D. carota.
Mapping wheat diversity in Turkey
![]() No sooner did I blog about a paper which mapped diversity in a crop in Mexico across time, that I came across one mapping diversity in another crop in Turkey. 1
No sooner did I blog about a paper which mapped diversity in a crop in Mexico across time, that I came across one mapping diversity in another crop in Turkey. 1
The authors — a truly international bunch from the Bahri Dagdas International Agricultural Research Institute, the Vavilov Institute, CIMMYT, ICARDA, FAO, and UC Davis — describe a huge effort to collect and describe wheat from all over the country during 2009-2014. They then compare the resulting socioeconomic and geographic patterns of diversity with a previous survey done by the Vavilov Institute in the 1920s, the results of which were published in 1935-9 by Mirza Gökgöl, a Turkish scientist who accompanied that expedition. 2
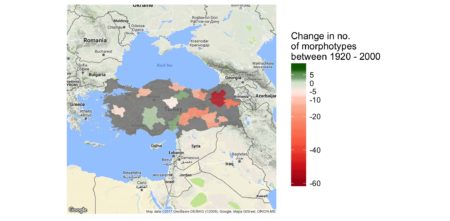
As in the Mexican maize study, diversity in the crop was measured in terms of distinct morphological types, and was unevenly distributed around the country, but unlike in that work, diversity was calculated for each administrative province, rather than in each square in a grid. As provinces vary widely in size, and in the extent to which wheat is grown in them, this approach is not ideal.
Nevertheless, it was possible to make direct comparisons between the two study periods for about 17 provinces. Discounting some very rare and very minor morphological variants, it seems fairly safe to say that for these provinces, the number of distinct wheat types went down about 59% overall, though with large differences among provinces. There is no map showing this in the paper, but, thanks to my colleague Nora Castañeda, I can help you with that. Red is down, green is up.
What explains wheat landraces still thriving in some places, and not in others?
Socioeconomic data indicated that landrace farmers are found mostly in remote mountainous subsistence communities with very little grain trade, small areas planted to wheat, and relatively simple production technologies. The key reasons famers continue to grow landraces are their grain qualities and adaptation to abiotic stresses.
Animate the apocalypse
You know that paper entitled Biodiversity redistribution under climate change: Impacts on ecosystems and human well-being, that we included in Brainfood a couple of weeks back?. The money quote was: “The indirect effects of climate change on food webs are also expected to compound the direct effects on crops.” Ok, well, you don’t have to read it. All you have to do is watch a 1.5 minute video.
Brainfood: Slow Food, Runner bean diversity, Bamboo diversity, Istrian grapes, Smelly cheeses, Wild pseudocereals, Diversity & phenology, VAM diversity, Oases apocalypse, Wild wheat physiology, PepperHub, Bactrian camel diversity, Swiss livestock, CWR conservation, Tree database
- Developing radically-new meanings through the collaboration with radical circles: Slow Food as a platform for envisioning innovative meanings. Companies should collaborate with radicals. Presumably in order to turn them. #resist
- Unraveling agronomic and genetic aspects of runner bean (Phaseolus coccineus L.). At least we know what we don’t know.
- Total leaf crude protein, amino acid composition and elemental content in the USDA-ARS bamboo germplasm collections. If you want to use bamboo as feed, you need to choose among the 100-odd species very carefully.
- The Gene Collection of Autochthonous Wine Grape Varieties at the Institute as a Contribution to the Sustainable Development of Wine Growing and Viticulture in Istria. 3591 seems a hell of a lot, but wow.
- Phage Biodiversity in Artisanal Cheese Wheys Reflects the Complexity of the Fermentation Process. Modern methods kill a lot of phages.
- Setting conservation priorities for Argentina’s pseudocereal crop wild relatives. Go north, young CWR researcher!
- Flowering phenology shifts in response to biodiversity loss. Experimentally decreasing diversity in a California grassland advanced phenology.
- Activity, diversity and function of arbuscular mycorrhizae vary with changes in agricultural management intensity. No-till helps VAM, helps soils.
- Oases in Southern Tunisia: The End or the Renewal of a Clever Human Invention? I’m not hopeful.
- Physiological responses to drought stress in wild relatives of wheat: implications for wheat improvement. 4 species show promise.
- PepperHub, a Pepper Informatics Hub for the chilli pepper research community. Hot off the presses.
- Molecular diversity and phylogenetic analysis of domestic and wild Bactrian camel populations based on the mitochondrial ATP8 and ATP6 genes. The wild species is not the ancestor, and the domesticated species is a geographic mess.
- GenMon-CH: a Web-GIS application for the monitoring of Farm Animal Genetic Resources (FAnGR) in Switzerland. Upload data on your herd or flock, end up with a map of where the breed is most endangered.
- Stealing into the wild: conservation science, plant breeding and the makings of new seed enclosures. Ouch!
- GlobalTreeSearch – the first complete global database of tree species and country distributions. 60,065, about 10% crop wild relatives.
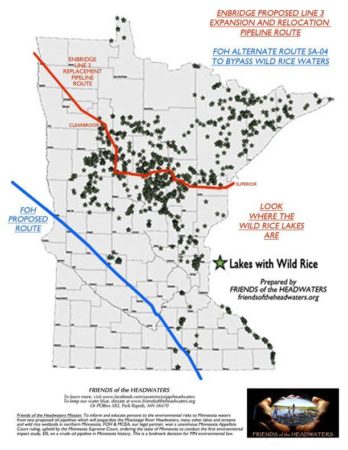
Faux wild rice in peril
I’m not saying it’s the most important thing about it, but that oil pipeline that is planned for Minnesota will go straight through lakes which are sacred to the local Native American peoples, and which generate about 50% of the world’s annual harvest of handpicked wild rice (which is Zizania, not Oryza, but still).