Much excitement at the World Forestry Congress yesterday over the launch of the World Agroforestry Center’s fancy-shmanzy new app.
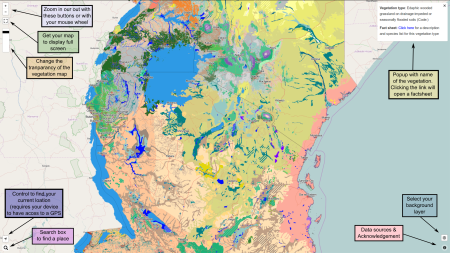
Long story short, it’s version 2 of a potential natural vegetation map of eastern and southern Africa. You can consult it in a browser, including on mobile devices, in Google Earth, or in your own GIS. Once you know where you are, or where you’d like to grown some trees anyway, you can get an idea of the natural vegetation there, and of what species might do well, for a variety of different purposes (honey production, say, or firewood).
Once you’ve selected a likely tree, you can get more information on it from ICRAF’s Agroforestry Species Dashboard. It’ll need a bit more road-testing than I have time for just at the moment, but it looks promising at first blush. One immediate reaction I do have is that it’s not possible to look for species that fulfil multiple functions: honey production and firewood, in other words. But I may be doing the thing an injustice.
 Our friend and occasional contributor