I don’t know exactly what a zero draft is, but the one for the Sustainable Development Goals is out. Remember, these are what will replace the Millennium Development Goals, when that battle is declared won.
Sustainable Development Goals are accompanied by targets and will be further elaborated through indicators focused on measurable outcomes. They are action oriented, global in nature and universally applicable to all countries, while taking into account different national realities, capacities and levels of development and respecting national policies and priorities. They integrate economic, social and environmental aspects and recognize their interlinkages in achieving sustainable development in all its dimensions.
It looks like we’re starting out with 17 goals:
1. End poverty in all its forms everywhere
2. End hunger, achieve food security and adequate nutrition for all, and promote sustainable agriculture
3. Attain healthy life for all at all ages
4. Provide equitable and inclusive quality education and life-long learning opportunities for all
5. Attain gender equality, empower women and girls everywhere
6. Secure water and sanitation for all for a sustainable world
7. Ensure access to affordable, sustainable, and reliable modern energy services for all
8. Promote strong, inclusive and sustainable economic growth and decent work for all
9. Promote sustainable industrialization
10. Reduce inequality within and among countries
11. Build inclusive, safe and sustainable cities and human settlements
12. Promote sustainable consumption and production patterns
13. Promote actions at all levels to address climate change
14. Attain conservation and sustainable use of marine resources, oceans and seas
15. Protect and restore terrestrial ecosystems and halt all biodiversity loss
16. Achieve peaceful and inclusive societies, rule of law, effective and capable institutions
17. Strengthen and enhance the means of implementation and global partnership for sustainable development
Presumably this is where the haggling begins. And I suspect most of that will happen over the targets and the indicators. These are the three that we’ll be watching out for in particular, though there are plenty of other ones that are relevant to our interests here:
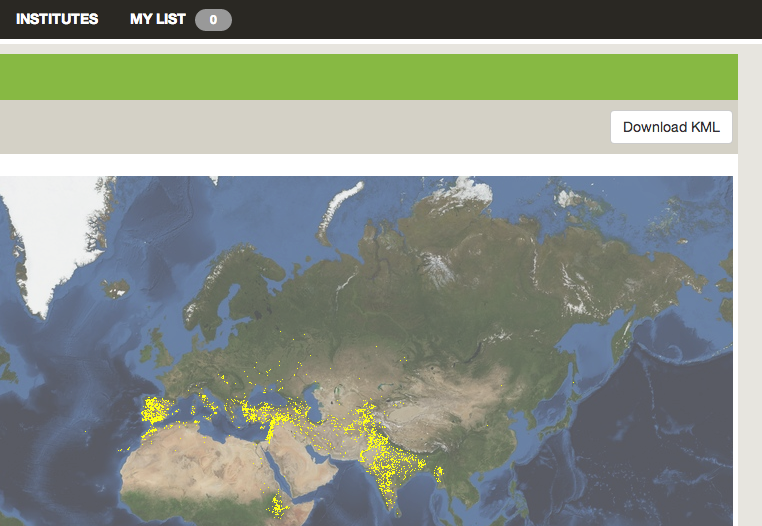
2.9 achieve by 2030 protection and sustainable use of agricultural biodiversity, including through enhanced use and application of indigenous practices and local and traditional knowledge, and through agricultural research and development related to agro-biodiversity and diversity of food
15.3 maintain genetic diversity of both cultivated plants, farmed and domesticated animals and their wild relatives including through effective cooperation of national institutions
15.7 ensure fair and equitable sharing of benefits arising from the utilization of genetic resources
I’d take those. Let’s hope they survive, and that they’re accompanied by some killer indicators.
We must maintain a positive and constructive spirit to achieve ambitious, aspirational and transformative SDGs- Germany #SustDev #OWG12
— UN DESA Sustainable Development (@SustDev) June 16, 2014