If a picture were worth a thousand words I would stop right now. But it isn’t, so I can’t. An explanation:
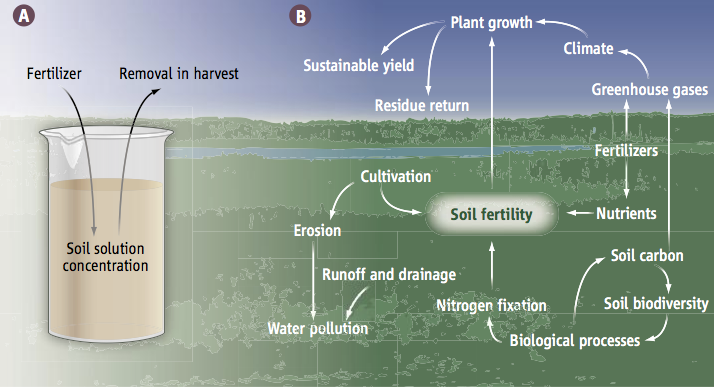
Exhibit A, on the left, caricatures, but only a bit, the worldview of many of those responsible for funding and carrying out research into agricultural productivity. Exhibit B, on the right, a slightly more nuanced view, lifted from an article by Mary C. Scholes and Robert J. Scholes in this week’s Science. 1 Scholes and Scholes are commenting on a paper by Noah Fierer and his colleagues in the same issue, which specifically addresses the little label in the lower right: “Soil biodiversity”.
Fierer’s paper 2 asks what the effect of agriculture might have been on the microbial diversity of soils in the tallgrass prairie of North America. There’s not that much left now, but they managed to sample 31 sites, “found primarily in cemeteries or nature preserves”. And they subjected DNA from the samples to some high-throughput DNA sequencing and analysis. The bottom line conclusion is that tallgrass prairie soils are very complex and that this complexity would be expected to affect all sorts of soil cycles, especially nitrogen and carbon.
Scholes and Scholes put those results into context, pointing out that
We have forgotten the lesson of the Dust Bowl: Even in advanced economies, human well-being depends on looking after the soil. An intact, self-restoring soil ecosystem is essential, especially in times of climate stress.
The diversity that Fierer and his team uncovered is strongly linked to functional diversity, independently measured. Prairie soils are particularly rich in Verrucomicrobia, “bacteria specialized for low-nutrient conditions, [which] are lost from the cultivated soils, making the soils less able to supply nutrients other than those provided as fertilizer”. And that’s the key to the bigger picture. Scholes and Scholes point out that:
[I]mproved technology—including the unsustainably high use of fertilizers, irrigation, and plowing—provides a false sense of security.
We need to stop thinking simplistically about the role of inorganic fertilisers and start to consider the soil in which our food grows.
An agricultural soil ecosystem that more closely approximates the close and efficient cycling in natural ecosystems, and that also benefits from the yield increases made possible by biotechnology and inorganic fertilizers, is needed to increase agricultural production to the levels that will be required while minimizing its adverse effects. Integration of the insights, innovation, and best practice from agronomy, ecology, soil biology, chemistry, physics, plant breeding, and natural resource governance is the only viable route to both feeding the world and keeping it habitable.
In other words, we have to do it, but it isn’t going to be simple. Knowing a bit more about what makes prairie soils both productive and self-sustaining may help the process of restoring degrading lands and preventing future degradation.