- Jeremy probes into wild asses at Vaviblog.
- Mapping the evolution of pathogens. And in kinda related news…
- The European oyster needs diversity. Well, natch.
- The tree forests of Yunnan, and, concidentally, the story of how the secret of their product got out.
- The Kaçkar Mountains at Yusufeli, northeast Turkey are in trouble. Any crop wild relatives there, among the bears and other charismatic megafauna
- Speaking of Turkey, here’s how to make one of its delicacies. But hey, if you don’t have vine leaves, you can use this.
- Having fun with yams.
- Drori does pollen.
- FAO’s Mitigation of Climate Change in Agriculture (MICCA) Project. Any agrobiodiversity-related stuff? Need to explore…
- “…conserving species may only require specific activities, such as collect and distributing seeds.”
- African school feeding programme uses “local” products. What would Paarlberg say? You can find out here, if you have 90 minutes to spare.
- British boffins breed self-shearing sheep. No, really.
Nibbles: Rice conservation and use, Tunisian genebank, Buno, Popcorn, Sustainability, Brazilian social networking, Strawberry breeding, Sunflower genomics, Climate change and fisheries
- Lots of Indian rice in the IRRI genebank. Any of it being used to develop drought-tolerant varieties?
- Lots of journalists in the Tunisian genebank.
- How they make coffee in Ethiopia.
- How they make popcorn the world over. You sometimes get popcorn (or popped sorghum) with coffee in Ethiopia, now I think of it. And since we’re on an Ethiopian kick, fancy some enjera? Gary Nabhan did.
- “Productivity vs. sustainability is a ‘false choice.’” Well I never. And probably not news to these people either, or these. But to these guys?
- A Twitter roundup from Embrapa.
- Ugly hybrid of two wild strawberries may cause allergies.
- Explanation of evolution of doubled genes in wild and cultivated sunflowers certainly causes pain in brain.
- Some good climate change news for the Atlantic croaker. Being a glass-totally-empty kinda guy I predict it tastes like shit.
Assisted migration: all there is to know (at the moment)
We’ve written before about assisted migration — giving plants (and animals) a helping hand to ensure that they can keep up with shifts in the areas in which they can thrive. “Managed relocation” is becoming a hot topic, which may be why the Chicago Botanic Garden is holding a one-day seminar on 11 June 2010. Details are currently sparse, but if you go, and especially if anyone says anything about crops or wild relatives, please share a report.
Diverse points of view on feeding Africa
We like to embrace different points of view here ourselves, though we also like to think there’s a certain consistency to most of what we say and do. Maybe that’s why I find it strange that a single blog, on a single day 1 can feature two such divergent posts. One — Homegrown Solutions to Alleviating Hunger and Poverty — is a thorough look at the role of indigenous fruit and vegetable crops in delivering a healthy and nutritious diet. The other — Breeding for Climate Change — links, almost without comment, to a report on the Bill & Melinda Gates Foundation’s project to deliver just two (one conventionally bred, one genetically engineered) drought-resistant maize varieties to sub Saharan Africa.
I have no doubt that genetic engineering, precision farming and other high-tech tools of modern intensive farming can supply all the calories the world will need even when it hosts 9 billion people. I do doubt that the 9 billion will actually get those calories. And I know that calories alone are not enough. People need nourishment, not merely calories.
Shortage of olive oil threatened
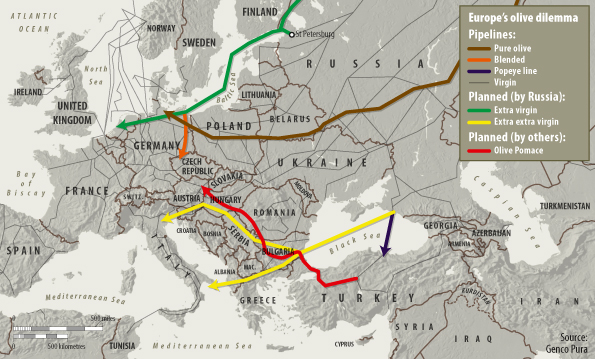
Disturbing news from The Economist:
It is becoming clear that reserves of olive oil will peak in the coming decade, as climate change wipes out most of the groves in the Mediterranean, the main production zone. The likes of Turkey will struggle to make up supply. Russia, however, expects to profit handsomely: its steppes, freed of permafrost, will soon host vast olive groves; a series of pipelines will send extra-virgin supplies westwards.
Somewhat disappointingly, The Economist seems to have taken no account of the benefits for the south of england. As we reported here earlier, home-grown olives are now on sale in the UK; can oil exports be far behind?