- The role of wild fruits and vegetables in delivering a balanced and healthy diet. Not great, until they’re domesticated.
- Maize Diversity, Market Access, and Poverty Reduction in the Western Highlands of Guatemala. Forget maize.
- Evaluation of Wild Lentil Species as Genetic Resources to Improve Drought Tolerance in Cultivated Lentil. Environment explained drought response in wild lentils better than molecular classification.
- Geographical distribution, diversity and gap analysis of East African sorghum collection conserved at the ICRISAT genebank. Both Sudans.
- Explaining the Ethiopian farmers’ perceptions on potential loss of traditional crop varieties: A principal components regression analysis. Poor farmers know more, and care more, about loss of traditional landraces.
- High-throughput sequencing of African chikanda cake highlights conservation challenges in orchids. Those are very biodiverse cakes, but not in a good way.
- Revisiting the ‘cornerstone of Amazonian conservation’: a socioecological assessment of Brazil nut exploitation. It’s actually in pretty good shape, but that doesn’t mean it can’t be improved.
- Phylogenetic Prediction of Alternaria Leaf Blight Resistance in Wild and Cultivated Species of Carrots. Look for taller material in clade A.
- Starch granule evidence for the earliest potato use in North America. S. jamesii may have been used for 10,000 years in Utah.
- Genome-Wide Association Study of Grain Architecture in Wild Wheat Aegilops tauschii. Two genetic lineages, with big differences in grain width and weight.
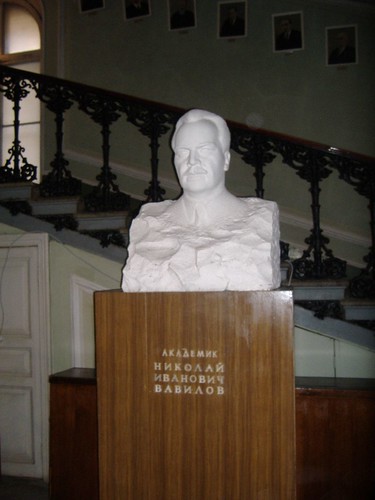
Photographing VIR
Swiss (I think) photographer Mario Del Curto has a book out about the Vavilov Institute, called The Seeds of the Earth. I’ve just found out about it at The Eye of Photography, but there’s a better blurb on the website of the Department of Plant Molecular Biology, Faculty of Biology and Medicine of the University of Lausanne. Where you can also find an order form. If you don’t want to shell out the 40-odd euros, you can just look at my photos.
ILRI looking for a forages genebank manager
The International Livestock Research Institute (ILRI) seeks to recruit a dynamic Forage Scientist with a keen interest in genetic resources, to head the genebank at ILRI and to manage the composition of tropical and sub-tropical forage collections both at ILRI and the International Center for Tropical Agriculture (CIAT). This is a joint ILRI/CIAT position that will be based at the ILRI campus in Addis Ababa, Ethiopia.
The thinking behind that “joint position” thing is explained in the global forages strategy.
Brainfood: Taste breeding, Cat domestication, ITPGRFA in USA, CWR extravaganza, Ecology & ag, Brassica identification, Biodiversity monitoring, Languages, Species recovery, Benin pigeonpea
- Sensory sacrifices when we mass-produce mass produce. You need consumer-assisted selection.
- The palaeogenetics of cat dispersal in the ancient world. Two Middle-Eastern sub-populations of one sub-species contributed to domestication, at different times, and the result spread first with agriculture and then aboard ships. But we haven’t changed them in the same way we’ve changed dogs etc. You don’t say.
- U.S. ratification of Plant Treaty: benefit sharing ambiguity for plant genomics researchers does not change. But what about genomics data?
- Wading Into the Gene Pool: Progress and Constraints Using Wild Species. Introduction to the Special Section on CWR.
- Plant ecological solutions to global food security. Introduction to the Special Feature on Ecological Solutions to Global Food Security. The intersection with the above is probably here.
- A multiplex PCR for rapid identification of Brassica species in the triangle of U. Now there’s no excuse.
- Connecting Earth observation to high-throughput biodiversity data. I don’t see any reason why the same thinking couldn’t be applied to crop diversity.
- Linguistic diversity of natural UNESCO world heritage sites: bridging the gap between nature and culture. 80% of Natural WHSs intersect at least one indigenous language.
- Overcoming barriers to active interventions for genetic diversity. Embrace the hybrid by focusing on process, not form.
- Utilization and farmers’ knowledge on pigeonpea diversity in Benin, West Africa. For some reason, farmers don’t like coloured seeds.
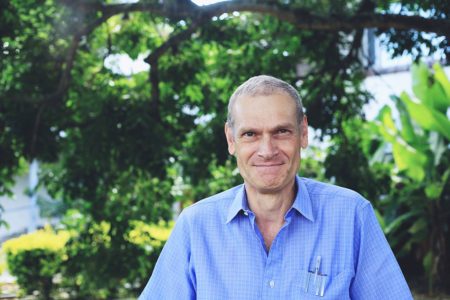
Arise, Sir Daniel
From the Facebook page of the Crop Trust:
Our friends at CIAT inform us that yesterday Daniel Debouck received the Order of Leopold for his 40 years of service to the scientific community. Named in honour of King Leopold I, and awarded by Royal order, this is the highest order of Belgium. We congratulate Daniel, who’s one of the tireless scientists at the front lines of agro-biodiversity conservation. As head of the Genetic Resources Unit at CIAT, he’s made sure the world’s largest bean, cassava and forages collections are safe and available for plant breeders, researcher and farmers to use.
Since its inception, CIAT’s genebank has distributed more than half a million samples from 141 countries to requesters in more than 160 countries. Find out more here.
Well done, Daniel! Great to see the work of another genetic resources scientist being recognized.
Read more about Daniel’s work on a recent CIAT blog post, “On the trail of ancient treasure in Peru.”