On the occasion of the World Cowpea Conference 2010 in Dakar, which is going on now and has resulted in some press interest, IITA have published an interview with the manager of their genebank. Which of course maintains the world’s largest cowpea collection on behalf of us all. Many of the points she makes are addressed in the global strategy for conservation and use of cowpea genetic resources, which I believe she’ll be presenting in Dakar. Dominique doesn’t mention core collections, but another IITA article does. We even have the results of a gap analysis for wild Vigna in Africa. And finally, also doing the rounds is a summary of the results of a survey of users of the collection. Though I wouldn’t bet the farm on those cost numbers turning out to be accurate. Do we have any readers in Dakar who’d like to tell us what’s going on?
Berry Go Round comes around again
The blog carnival know as Berry Go Round is up and about for the 31st time. Do go have a look at its tempting miscellany of botanical lore. And if you arrived here from A Blog Around The Clock, welcome.
Plants in peril
Kew and IUCN made a splash today with the Sampled Red List Index for Plants. A representative sample of 7,000 species of plants was selected from the comprehensive IUCN Red List Index for detailed monitoring. 1 You can contribute to the Sampled Red List in a wiki-like environment, and follow its progress on the inevitable blog. An interactive map allows some basic exploration of the data. The headline number is that 25% of plant species are threatened. There are various crop wild relatives among the 7,000 species, 2 so it might be possible to calculate some statistics for that particular category, to complement other efforts.
Nibbles:Collecting missions, Grapes, Beans, Genome, Local markets, Water
- From GBDBH, a light glimmers: browse and search records of crop collecting missions.
- “Variations in early-season temperatures may alter substantially grapevine yield formation.” For Cab Sauv at any rate.
- Mixture of beans as good as resistant variety against anthracnose disease.
- Genome inversion spurs ecotypic differentiation.
- A review of medicinal plant markets.
- Today’s huge global dataset: “threats to human water security and freshwater biodiversity in global river systems.”
The geography of black rice
Sometimes it pays to spend some time in Genebank Database Hell, if you can fight through the pain.
You may remember a piece recently about the antioxidant properties of black rice. But where does black rice come from? Well, hanging around with the Genesys and GRIN-Global crowd in the past couple of days has allowed me to come up with this map in answer to that deceptively simple question.
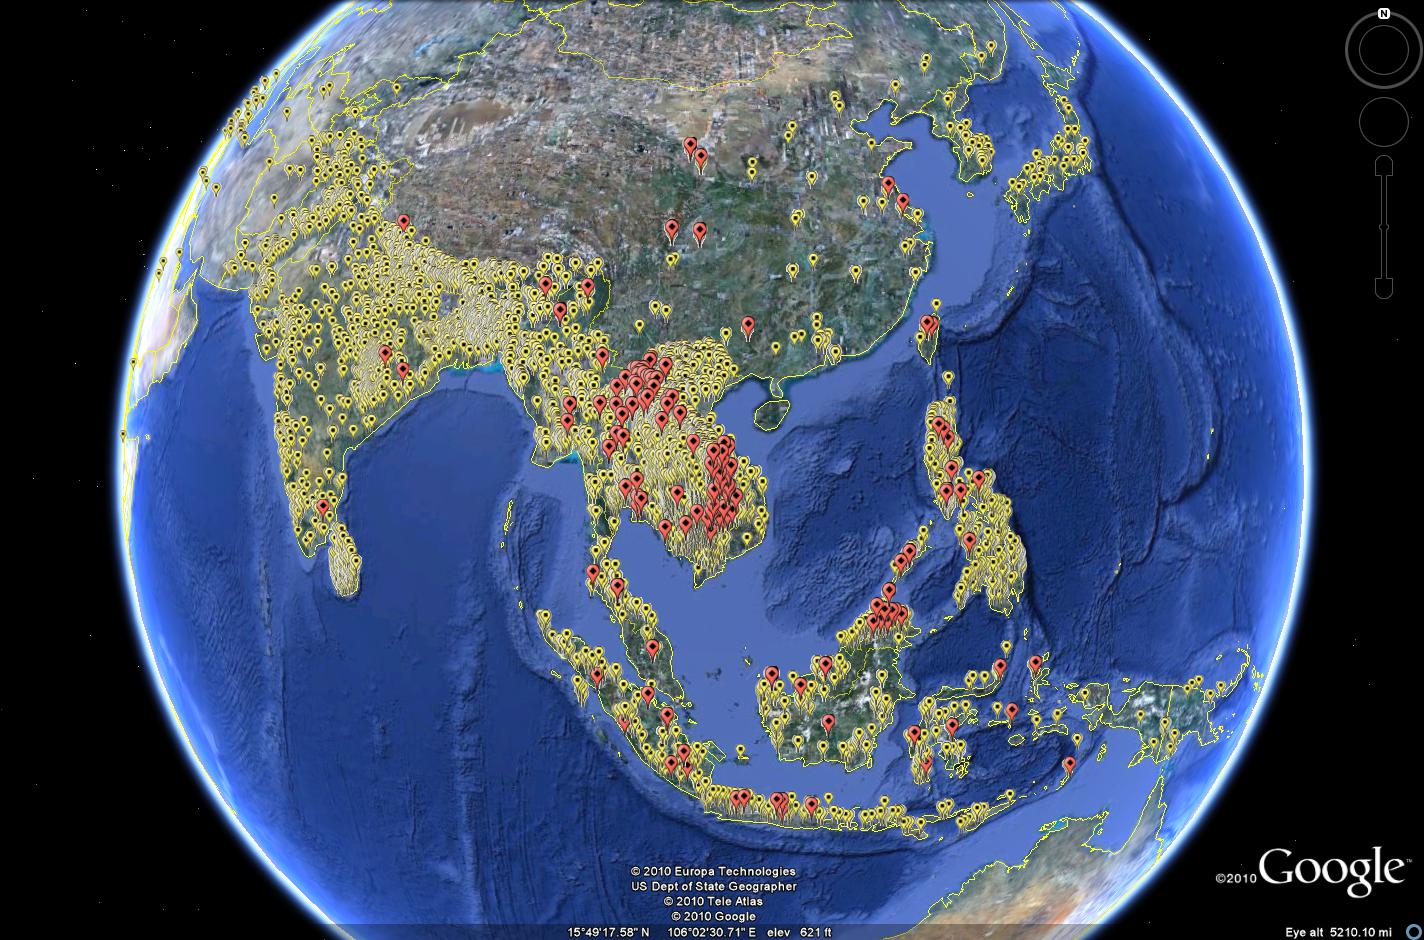
In yellow are all the rice accessions from Asia which have coordinates, as recorded in the IRRI database, EURISCO and GRIN. In red are the black rice accessions.
You’d have thought such a map would be pretty easy to make. But you’d be wrong. I had to get an Excel spreadsheet from IRRI with the characterization data, 3 and mash it up with the passport data in Genesys for the same accessions, and then export two separate kmz files and fiddle around in Google Earth. 4 Well, they don’t call it Genebank Database Hell for nothing. But it is getting better, slowly but surely.