I’ve often pontificated about Genebank Database Hell here, I’m sure to the annoyance of many readers. But we do have a chance to do something about at least one little corner of hell. If you want to do your bit, please take the Genesys user survey. Thanks!
Vote for African veggies!!
Great to see a project on African Leafy Vegetables in western Kenya in the running for the Farming for Biodiversity prize at Solution Search. Here’s what they say about return on investment:
The ROI is 39%. The budget was US $150,000 for 2 years. Returns from the sale of ALVs amount to $52,200 per season, for 4 planting seasons. The biggest return, however, is the farmers renewed sense of empowerment. “I never imagined I could go out and find a market for my veggies” said Ms. Joyce Okwara from Busia, as well as improved nutrition in schools and clinics. Funds supported a feasibility workshop to discuss limits and opportunities of linking farmers to institutional markets, the development of a farmer business school and its subsequent rolling out, the acquiring and distribution of certified ALV seed to farmers and nutrition education in local schools and clinics. Additional funds would allow the scaling-up of this model.
Good luck to the Sustainable Income Generating Investment Group (SINGI) in Busia! Vote for them!
Plant threat assessments online
A tweet from Global Trees Campaign, reporting from the Botanical Gardens Congress, reminded me of a BGCI online tool that I haven’t yet blogged about, at least here.
Using @bgci's databases to identify the gaps in tree conservation #TreeTuesday #6gbgc pic.twitter.com/dc2WNlLLII
— GlobalTreesCampaign (@globaltrees) June 27, 2017
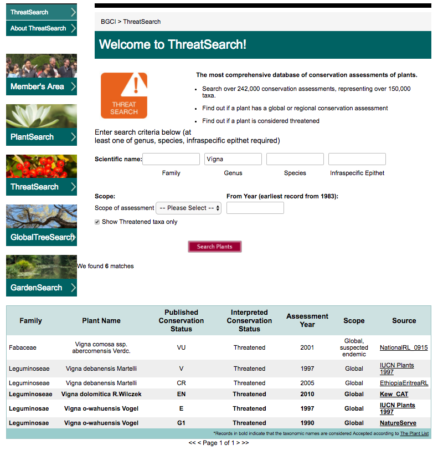
People are aware of Global Tree Search, Plant Search and Garden Search. But Threat Search?
Well, it’s “the most comprehensive database of conservation assessments of plants,” including 242,000 conservation assessments on over 150,000 taxa. And very useful it is too.
Brainfood: Banana GWAS, MGIS, Commodification and racialization, Native tree seeds, Tea in China, Potato in China, Indian eggplant, Rapid phenotyping, Ag & environment
- Trait variation and genetic diversity in a banana genomic selection training population. You can use easy-to-measure traits as proxies for important but difficult-to-measure traits. Both of which will hopefully end up in…
- MGIS: managing banana (Musa spp.) genetic resources information and high-throughput genotyping data. Very cool. So when can we expect the data in Genesys?
- Heirloom rice in Ifugao: an ‘anti-commodity’ in the process of commodification. Calling a landrace a “heirloom variety” is just another form of capitalist oppression.
- Race, Status, and Biodiversity: The Social Climbing of Quinoa. Not to mention racist.
- To what extent are genetic resources considered in environmental service provision? A case study based on trees and carbon sequestration. Clean Development Mechanism (CDM) afforestation/reforestation project design documents are often unrealistic about the chances of sourcing sufficient quantity and quality of seeds of indigenous species.
- Diversity analysis on catechin genetic of wild tea plant from Yunnan province. They determine whether a variety is used for green or black tea.
- Genetic differences between potato strains introduced from International Potato Center (CIP) and domestic potato resources by SSR molecular markers. The CIP varieties are quite different to the Chinese ones. But we kinda knew that.
- SSR marker analysis points to population admixture and continuum of genetic variation among Indian landraces of brinjal (Solanum melongena L.). Brinjal gets moved around a lot.
- A high-throughput, field-based phenotyping technology for tall biomass crops. Estimate plant height and stem diameter in sorghum, say, without leaving the office.
- Comparative analysis of environmental impacts of agricultural production systems, agricultural input efficiency, and food choice. Better for environment to change dietary habits than production systems.
Botanical gardenfest takes root
The 6th Global Botanic Gardens Congress of Botanic Gardens Conservation International is being hosted by the Conservatory and Botanical Garden of Geneva, Switzerland, starting today. Follow with #6GBGC.
Oh, and there’s also Plant Biology 2017 in Hawaii, with #plantbio17. So many hashtags, so little time…