Thanks to Brian Ford-Lloyd, Emeritus Professor of Plant Conservation Genetics at the School of Biosciences, University of Birmingham, for this contribution, hopefully the first of many.
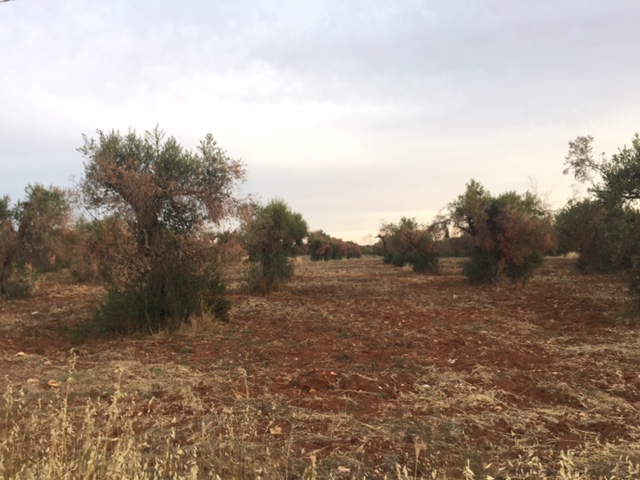
Aside from beet cyst nematode, rhizomania is the most important disease of sugar beet worldwide, having plagued growers since the early 1950s. It can only be combated by growing resistant varieties, and there are two known major genes conferring resistance, one having been discovered by conventional means in the sugar beet crop, and the other in wild sea beet (Beta vulgaris ssp. maritima) populations in northern Europe. In a recent publication, Capistrano-Gossmann et al. (2017) have identified the actual wild beet gene involved (Rz2), using a complex but powerful molecular genetic process, a modified version of mapping-by-sequence together with the generation of a draft genome sequence and fine mapping. 1
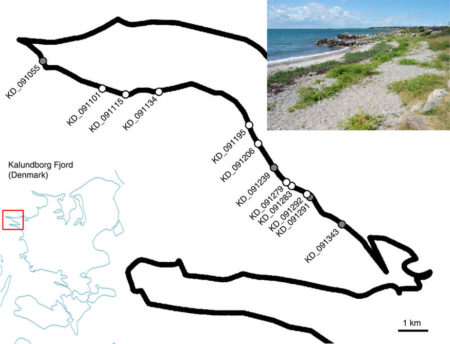
But let’s leave aside the detailed methodology, including what the gene actually encodes! As far as readers of this blog are concerned, what is the significance of this piece of research? It all started with the existing knowledge that a large population of sea beet in Denmark contained some plants that showed the resistance trait, and in my recollection this population had been studied for many years. But success depended upon sampling plants (189 of them) directly from the in situ population that covered a stretch of at least 10 kilometers of the Danish coast. The magic is that, compared to conventional synthetic breeding populations, this wild population possessed a distinct benefit — many generations of ‘random’ outcrossing resulted in low linkage disequilibrium and high population admixture. This was the key to successfully fine-mapping and genomically pinpointing the causal gene within the beet DNA sequence.
As the authors rightly point out, their research not only demonstrates the value of crop wild relatives, but it also highlights the need for ensuring that populations of these wild relatives are adequately conserved in their natural habitats and are subjected to appropriate and detailed evaluation for useful traits.
There are some important points that arise from this. Firstly, this particular use of a crop wild relative is not direct in the sense of transferring the gene by way of a plant breeding programme, but lies in the molecular isolation of the gene, that could then be subsequently transferred by whatever means, including genetic manipulation of one sort or another. Secondly, ‘evaluation’ of germplasm conserved in situ is something that has not received much attention, to my knowledge. And thirdly, preserving the population’s size and integrity would be important in maintaining its population genetic structure and ‘power’. Allowing it to go through a genetic bottleneck would diminish its value.
It is fortunate that wild sea beet is not categorised by IUCN as being under threat and large outbreeding populations do exist. The genetic potential of one or two other wild beets (Beta patula, for example), with smaller population sizes, is more in question.