- Developing radically-new meanings through the collaboration with radical circles: Slow Food as a platform for envisioning innovative meanings. Companies should collaborate with radicals. Presumably in order to turn them. #resist
- Unraveling agronomic and genetic aspects of runner bean (Phaseolus coccineus L.). At least we know what we don’t know.
- Total leaf crude protein, amino acid composition and elemental content in the USDA-ARS bamboo germplasm collections. If you want to use bamboo as feed, you need to choose among the 100-odd species very carefully.
- The Gene Collection of Autochthonous Wine Grape Varieties at the Institute as a Contribution to the Sustainable Development of Wine Growing and Viticulture in Istria. 3591 seems a hell of a lot, but wow.
- Phage Biodiversity in Artisanal Cheese Wheys Reflects the Complexity of the Fermentation Process. Modern methods kill a lot of phages.
- Setting conservation priorities for Argentina’s pseudocereal crop wild relatives. Go north, young CWR researcher!
- Flowering phenology shifts in response to biodiversity loss. Experimentally decreasing diversity in a California grassland advanced phenology.
- Activity, diversity and function of arbuscular mycorrhizae vary with changes in agricultural management intensity. No-till helps VAM, helps soils.
- Oases in Southern Tunisia: The End or the Renewal of a Clever Human Invention? I’m not hopeful.
- Physiological responses to drought stress in wild relatives of wheat: implications for wheat improvement. 4 species show promise.
- PepperHub, a Pepper Informatics Hub for the chilli pepper research community. Hot off the presses.
- Molecular diversity and phylogenetic analysis of domestic and wild Bactrian camel populations based on the mitochondrial ATP8 and ATP6 genes. The wild species is not the ancestor, and the domesticated species is a geographic mess.
- GenMon-CH: a Web-GIS application for the monitoring of Farm Animal Genetic Resources (FAnGR) in Switzerland. Upload data on your herd or flock, end up with a map of where the breed is most endangered.
- Stealing into the wild: conservation science, plant breeding and the makings of new seed enclosures. Ouch!
- GlobalTreeSearch – the first complete global database of tree species and country distributions. 60,065, about 10% crop wild relatives.
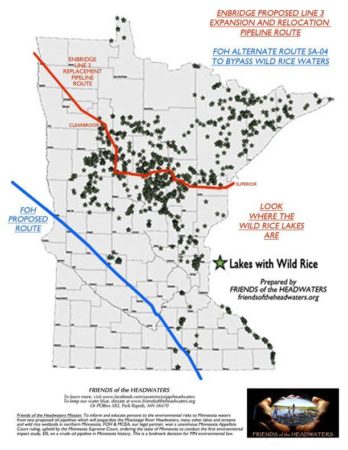
Faux wild rice in peril
I’m not saying it’s the most important thing about it, but that oil pipeline that is planned for Minnesota will go straight through lakes which are sacred to the local Native American peoples, and which generate about 50% of the world’s annual harvest of handpicked wild rice (which is Zizania, not Oryza, but still).
Seeing the wood and the trees
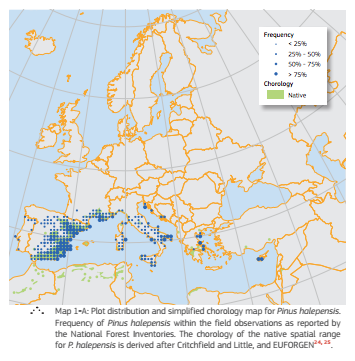 The day after the Global Tree Assessment is published by BGCI, which revealed there are about 60,000 tree species in the world, is also a good time to link again to the wonderful European Atlas of Forest Tree Species. Now all we need is the same thing for Brazil, which has about 9,000 of those 60,000. BTW, a very quick check suggests that about 1% of trees are crop wild relatives, globally. More on this later.
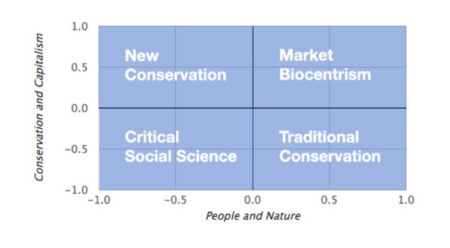
Are you a new or a traditional conservationist?
Although discussions about the aims and methods of conservation probably date back as far as conservation itself, the ‘new conservation’ debate as such was sparked by Kareiva and Marvier’s 2012 article entitled What is conservation science?
Two prominent positions have emerged in this debate, that of Kareiva and Marvier, which we label ‘new conservation’ (top-left quadrant of the figure below), and a strongly opposed viewpoint that we label ‘traditional conservation’ (bottom-right quadrant).
These positions can be clearly distinguished by their views on nature and people in conservation on the one hand, and on the role of corporations and capital in conservation on the other hand (the two axes in the figure).
Want to know which quadrant you fall into? Take the survey.
I did, and this is what I got.
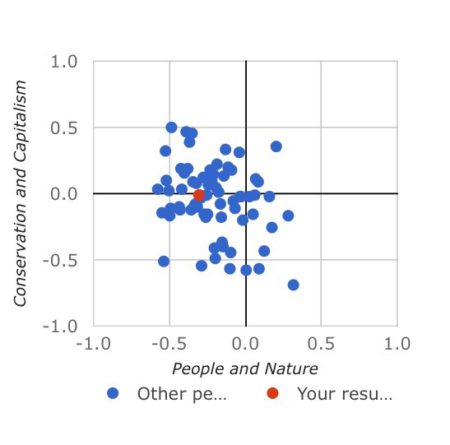
Which basically means I’m wishy-washily neutral (agnostic? conflicted?) on the role of the private sector, and apparently think conservation needs to show some benefit for people, in particular poor people. And in that it seems I’m pretty near the centroid of opinion, at least when it comes to the last 100 people who took the survey. Of course, this is for biodiversity conservation. I wonder if the results would be different for conservation of agricultural biodiversity.
Mapping the hell out of maize diversity in Mexico
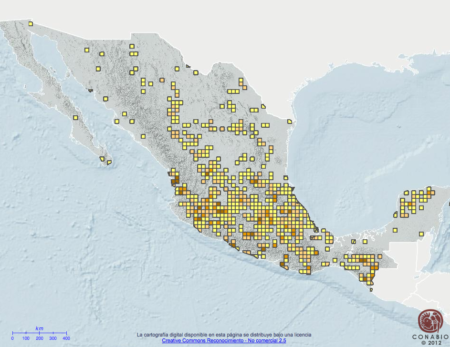
![]() Thanks to a Facebook post, I’ve just come across the “mapoteca digital” of CONABIO, the Comisión Nacional para el Conocimiento y Uso de la Biodiversidad of Mexico. 1 It has point maps of the distribution of both wild and cultivated beans and calabazas, and of wild maize; but most interesting to me were the maps of the distribution of the richness of cultivated maize races, based on collections made at different times in the past. The data were put together by the “Proyecto Global de Maíces” (2006-2010), and the maps are also available in a PDF.
Thanks to a Facebook post, I’ve just come across the “mapoteca digital” of CONABIO, the Comisión Nacional para el Conocimiento y Uso de la Biodiversidad of Mexico. 1 It has point maps of the distribution of both wild and cultivated beans and calabazas, and of wild maize; but most interesting to me were the maps of the distribution of the richness of cultivated maize races, based on collections made at different times in the past. The data were put together by the “Proyecto Global de Maíces” (2006-2010), and the maps are also available in a PDF.
Here’s the map for 1940-1965, based on about 3,000 collections.
And here’s the map for 1991-2000, based on 12,000 collections.
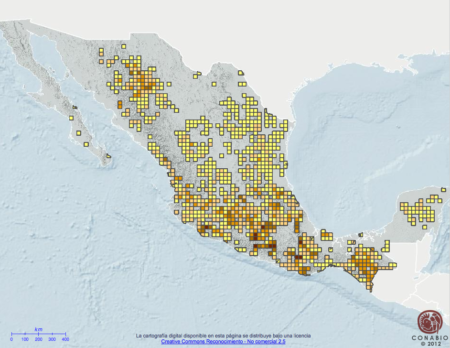
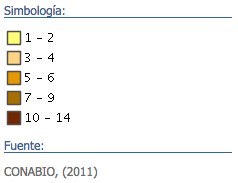 The legend used in both maps is at the left here. Looking at the maps, lots of questions came to mind. Why are we getting higher numbers of races in the 1990’s? Is it that the collecting was more thorough then? Or are races moving around more now? There is lots of information on the individual races on the project website, including actual and potential distribution maps. And you can download the raw data. So another thing that came to mind was that surely someone must have gone through all this stuff in detail. And sure enough, yes someone had indeed gone through all this stuff in detail, Peralta & Golicher in 2014. 2
The high rank correlation between the three collection efforts indicate that relative abundance of races has not changed considerably since 1950. Races that were common in 1950 were also common in 2005, and the same can be said for rare races, none of these were apparently more common in 1950. Correspondingly, the comparison of distribution and richness models for the three sampling efforts does not suggest a general decline in richness nor in distribution for 43 of the 47 races studied, and in the other four cases the declines are relatively minor and require verification. The recent increase in distribution for two races (Tuxpeño and Celaya) may be explained by the outstanding importance these have had as components in commercial cultivars, it is not uncommon to find recycled and creolized landraces that had their origin as commercial seeds. Also, no extinctions were reported for the 47 races studied since all were sampled in the last collection effort between 1997 and 2010. Therefore, in a broad sense, at the race level of classification we do not find signs of substantial genetic erosion between 1943 and 2010. That is not to say no losses of local populations have occurred.
I can’t for the life of me understand why I haven’t blogged about this paper before (or indeed the project that generated the data), bringing together as it does two of my very favourite things, agrobiodiversity and mapping 3, but I’m more than happy to rectify that oversight here and now. I can’t help thinking there’s more to be mined from this dataset yet.