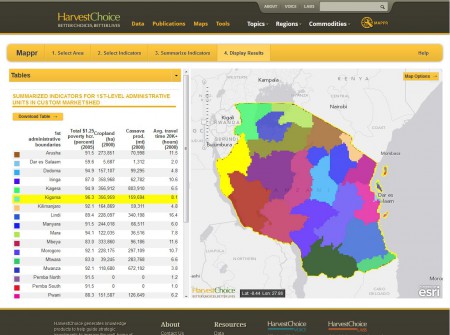
A couple of days ago we donned the guise of an investor seeking a site for their cassava processing plant in Tanzania, and ended up expressing some reservations about the advertised ability of HarvestChoice’s MAPPR online mapping tool to help us out with that tricky task. We thus issued a challenge: “You be that policymaker in the blurb that wants to ‘identify regions of a country with high concentrations of both poverty and cropland.’ If you can do that, I promise to host the results here. And apologize to the MAPPR team.” Well, Stanley Wood has risen to the challenge in a comment on that post, which we now reproduce below. He also explains how the team intends to go about improving MAPPR, based in part on user feedback such as this. As for the apology, I’m happy to issue it. But I have one question for Stanley and the team. Do they really think the average policymaker is going to want to fiddle about sorting columns in an Excel spreadsheet to “identify regions of a country with high concentrations of both poverty and cropland”? Especially as they kind of have been promised a nice map in which the answer would just jump out at them… Anyway, we look forward to test-driving future versions of a tool with obviously a lot of potential, but which just isn’t quite there yet, and could obviously do with a bit more attention to the kind of specific use cases Stanley presents here, and we dealt with earlier. Many thanks to Stanley for taking the time to reply, and very best wishes to him and the MAPPR team.
Thanks for a very helpful posting in terms of sharpening our focus on potential MAPPR improvements. That rather long pipeline already includes alleviating some of the frustrations you encountered, particularly the inability to download user-created maps in addition to the table and chart download options. As shown on your screenshots of the Market Shed summary tool it is already possible to download the map in GIS format (the button with the – admittedly arcane – inscription “Download .SHP”), but that feature is indeed absent in the other summary options. What you (and others) have highlighted is also the lack of an option to download the map you created map in a cleanly annotated .png or similar format to put directly into a report or presentation. I think we maybe a month away from adding that capability.
We will follow up with our way more technical folks on the likely causes of the dreaded “404″ and see what that issue might be. I also don’t know what HI is, but I’m sure Chris can enlighten us. We will soon be adding server memory to enhance performance which might be a fix if it proves to be a capacity issue.
On the final comment about poverty and cropland, I went into MAPPR myself and made a map and table in less than a minute highlighting their coincidence at a district level in Tanzania. I saved the map and downloaded the table (and just as you did I had to grab the map with Print Screen for the time being).
Are some aspects of MAPPR both limiting and a bit kludgy? Indeed so. But feedback like yours and that of other users, in addition to our own pipeline of fixes and enhancements, can only serve to make it better. Indeed, since you’re an investor, we welcome your investment in our data and tools to speed up those improvements!
Meanwhile, please keep the feedback coming.
Stanley Wood

One Reply to “MAPPR responds”