- Management increases genetic diversity of honey bees via admixture. No domestication bottleneck there!
- Enhancing innovation in livestock value chains through networks: Lessons from fodder innovation case studies in developing countries. Fodder innovators of the world, organize. If you don’t, you will lose your value chains.
- Introduction to special issue on agricultural biodiversity, ecosystems and environment linkages in Africa. Special issues? What special issue?
- The construction of an alternative quinoa economy: balancing solidarity, household needs, and profit in San Agustín, Bolivia. Despite the allure of fancy denominations of origin and the like, old-fashioned cooperatives, and the much-maligned intermediary, manage to hang on in there.
- Species–genetic diversity correlations in habitat fragmentation can be biased by small sample sizes. Can.
- The original features of rice (Oryza sativa L.) genetic diversity and the importance of within-variety diversity in the highlands of Madagascar build a strong case for in situ conservation. Actually the way I read it, the stronger case is for ex situ. But see what you think.
- Population structure of the primary gene pool of Oryza sativa in Thailand. In situ Strikes Back.
Nibbles: Mapping Life, PES, Quinoa, Forest restoration
- Mapping Life is live. Will livestock and crops eventually be there?
- How Valuing Nature Can Transform Agriculture. Errr … dunno. Is this really brainfodder?
- A humble agronomist considers the de-commoditisation of quinoa in Bolivia.
- Bioversity says that forest restoration should make better use of genetic diversity.
The how and why of indicators of agricultural biodiversity
![]() Let us assume, for the sake of argument, that one crop variety does disappear every single day. The question still remains: does it matter? After all, the variety that was just lost yesterday might be very similar to one that’s still out there today. That’s part of the reason why a group of French researchers has just come up with “A new integrative indicator to assess crop genetic diversity,” which is the title of their paper in Ecological Indicators. 1
Let us assume, for the sake of argument, that one crop variety does disappear every single day. The question still remains: does it matter? After all, the variety that was just lost yesterday might be very similar to one that’s still out there today. That’s part of the reason why a group of French researchers has just come up with “A new integrative indicator to assess crop genetic diversity,” which is the title of their paper in Ecological Indicators. 1
Christophe Bonneuil and his co-workers thought that, given the data, they could come up with something more powerful and more widely applicable than richness (i.e. the number of different varieties) or the standard diversity indicators (i.e. various combinations of richness and evenness). So they started with number of varieties, but then they factored in the relative extent to which each was grown in their study area, the departement of Eure-et-Loire in France (which is the evenness bit), how genetically distinct each was (which is the bit which addresses the pesky question of how different the variety that disapeared today is from all the other ones left behind), and how much genetic diversity there was inside each.
They got the data on genetic differences among varieties by comparing genebank samples of all the wheat types grown in Eure-et-Loire from 1878 and 2006 at 35 microsatellite loci, and data on acreage of each variety at different points in time from various archival sources. Internal genetic diversity was set at one of three values derived from the literature, depending on whether the variety was a landrace, an old commercial line or a modern pure line.
They put all that together into this monster indicator of allelic diversity in the landscape,

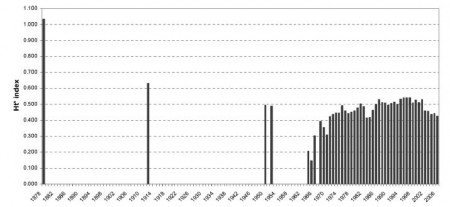
and then calculated it for different times periods, and got this:
That shows a decrease in diversity as landraces are replaced with modern varieties, but, interestingly, something of a resurgence after the mid-1960s, as more diverse germplasm is introduced into breeding programmes. The indicator has been on a downward trend just lately, as the genetic relatedness of the most frequent varieties has increased. 2 Overall, it’s maybe a 50% drop since 1878. Not entirely dissimilar to the iconic 75% figure, and at least this wasn’t plucked out of thin air.
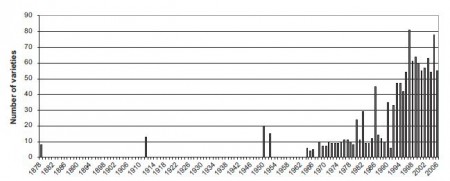
Interesting enough, but check out the trend in number of varieties over the same period:
Totally different. Pretty much an upward trend, albeit with some stuttering. Certainly no evidence from these data of massive erosion of diversity. Maybe the findings of Jarvis et al. (2008) that simple richness can be a useful indicator of diversity should be applied with caution if you’re not just dealing with landraces.
But how significant is it really that the value of this particular indicator of diversity, for all its fanciness, has decreased? Has anyone actually suffered as a result? I don’t know, but a second paper I came across this week suggests how one could find out. Roseline Remans and others associated with the Millennium Villages Project have a study out in PLoS ONE which adds yet another — different — nuance to diversity. 3 Their index considers not just how many different crops are grown on a farm, but also how different they are in their nutritional composition. Think of it as the nutritional analogue of the inter-varietal genetic diversity term in the French indicator. The more different in nutritional composition two crops are, the more complementary they are to local diets, the more important it is that both are there, the higher the resulting “functional” diversity index. And in fact the authors did find a positive relationship between their diversity indicator and nutritional status, at least at the village level.
Easy to imagine (though perhaps less easy to actually implement) a further refinement of Bonneuil et al.’s indicator which additionally integrates nutritional data, to yield an indicator of crop genetic and functional diversity. And, of course, once you have such a super-indicator, it might actually be possible to reward people on the basis of their success in maintaining it at high levels. Which, as it happens, is the subject of yet another paper I happened across last week. 4 But maybe that’s a paper too far for now. 5
Brainfood: Species prioritization, In situ costs, Mycorrhiza, Crop diversity indicator, Diet diversity indicator, Ag & Nutrition, Chestnut blight, Oyster translocation, Maize introgression, Italian asses, New hosts for pests
- Species vulnerability to climate change: impacts on spatial conservation priorities and species representation. Yes, you can focus on sensitive species, but it comes at the cost of representativeness.
- Estimating management costs of protected areas: A novel approach from the Eastern Arc Mountains, Tanzania. Those are $ costs per pixel on the map, which I’ve never seen before. Don’t think they took into account the effects of climate change, though. Maybe they should get in touch with the Aussies above?
- The use of mycorrhizal inoculation in the domestication of Ziziphus mauritiana and Tamarindus indica in Mali (West Africa). It would help.
- A new integrative indicator to assess crop genetic diversity. Includes varietal richness, spatial evenness, between-variety genetic diversity, and within-variety genetic diversity. Not much left, really. Anyway, remember this from last week? Anyone out there going to put 2 and 2 together?
- Assessing Nutritional Diversity of Cropping Systems in African Villages. A new tool! Different from the integrative indicator above! Anyone going to put 4 and 2 together?
- Agriculture-Nutrition Pathways Recognising the Obstacles. “The pathways between agriculture and nutrition seem to be laden with impediments, particularly in the form of intricate household preferences.” Those pesky preferences.
- The chestnut blight fungus world tour: successive introduction events from diverse origins in an invasive plant fungal pathogen. Asia to N. America to Europe, but more than once. All very complicated. The surprising thing is that low diversity and low admixture have nevertheless still resulted in success in disparate places. What fiendish molecular or biochemical mechanism is behind this? Only more research will show, natch.
- Translocation of wild populations: conservation implications for the genetic diversity of the black-lipped pearl oyster Pinctada margaritifera. Introducing some wild individuals near farms leads to more diverse farmed populations, right? Nope. The farmed populations are way diverse already and if anything the diversity is moving the other way.
- Maize x Teosinte Hybrid Cobs Do Not Prevent Crop Gene Introgression. That’s because the hybrid cobs break apart much more easily than maize.
- Detecting population structure and recent demographic history in endangered livestock breeds: the case of the Italian autochthonous donkeys. Microsatellites confirm existence of 8 breeds of Italian donkey, though there is also significant substructuring within each by farm. This apparently calls for a “synergic management strategy at the farm level,” which basically means using the breed as the unit of conservation but being careful about inbreeding.
- Evolutionary tools for phytosanitary risk analysis: phylogenetic signal as a predictor of host range of plant pests and pathogens. Work out host susceptibility by looking at existing pest preferences and phylogenetic distance from the stuff the pest is known to like.
Going, going, not gone?
My circles on GooglePlus alerted me to a report from NPR in the US, that the country’s oldest extant seed company is facing bankruptcy. The D. Landreth Seed Company has been going since 1784, and is credited with introducing the zinnia to the US and with popularising the tomato when it offered seed for the first time in 1820. Now the company is in trouble with its creditors.
That’s a great shame, the more so because it is happening in a country that, unlike some, 6 does not enjoy legislation preventing the sale of specific varieties. So what about market demand? Don’t people want the seeds that D. Landreth has to offer? Could it be that the company’s website is, as one commenter suggests, not entirely up to date?
At G+ Anastasia Bodnar said “it’d be sort of sad if the company went under, but as it says in the article, it’s not like the germplasm would disappear, it’d be auctioned off”.
Well, maybe, but what guarantee is there that whoever buys it would maintain it? And if Landreth can’t make a living selling that germplasm, maybe the reason is that lots of other people have the self-same varieties and are selling them successfully.
My question is this: “how many varieties offered by Landreth are not offered by another seed company in the US or elsewhere?”
In the old days, I might have checked by looking in Seed Savers Exchange’s wonderful publication the Fruit, Nut & Berry Inventory, but I see there hasn’t been a new edition since 2001, and I can’t see the database on which it was based anywhere. Having produced a UK version myself, I know how hard it is to do this kind of information wrangling, but it is really worthwhile.
<dream>Maybe I should attempt to Kickstart that effort again. </dream>

