- AI doesn’t recognize tropical agriculture very well.
- So presumably it can’t easily be used in assessing climate change impacts in agricultural heritage systems? FAO has some ideas on how to do it.
- Maybe rice heritage systems can be used to make cheese.
- I bet Andean blueberry (Vaccinium floribundum) goes great with rice cheese.
- But if not, heritage apples will probably do.
- The Hungarian genebank is hoping to inject heritage grains into non-heritage agricultural systems. AI and FAO unavailable for comment.
- Maybe AI can help with the mystery of this old seed collection at the Natural History Museum, London.
Brainfood: History edition
- Phylogenetics and evolution of Digitaria grasses, including cereal crops fonio, raishan and Polish millet. The history of wild Digitaria goes back 2–6 million years.
- Biogeography of Crop Progenitors and Wild Plant Resources in the Terminal Pleistocene and Early Holocene of West Asia, 14.7–8.3 ka. This is what the distribution of crop wild relatives looked like in West Asia 10 thousand years ago or thereabouts. No Digitaria, but plenty of other stuff.
- Ancient use and long-distance transport of the Four Corners Potato (Solanum jamesii) across the Colorado Plateau: Implications for early stages of domestication. At roughly the same time, a couple continents and an ocean over, a local potato species was being processed outside its rage. Was it cultivated? Do the math.
- State formation across cultures and the role of grain, intensive agriculture, taxation and writing. And a few thousand years later, there were domesticated grains, states, and taxes. In that order. Do the math.
- The Archaeology of Olive Oil Production in Roman and Pre-Roman Italy. Pretty sure the Romans had a state and taxes. They also had domesticated olives.
- Wines of Fire and Earth: Exploring the Volcanic Terroirs of the Canary Islands – a Case Study. No Romans on the Canaries, but plenty of vines.
- Black Death Land Abandonment Drove European Diversity Losses. The Romans and their successors, with their cereals, olives and grapes, were surprisingly good for landscape floristic diversity. The Black Death, not so much.
- The decades-old fantasy of enhancing pigeonpea productivity. Well that’s a bit of a letdown after a 6 million year journey.
- Past, present and future of local crop evolution. That’s because we needed Indigenous people and local communities to show us the way.
Nibbles: Agricultural expansion maps, Brassica diversity, Not against the grain, South African seedbanks, Safer peanuts, Diné seedbank
- Agriculture is bad for natural ecosystems. But great for maps, you have to admit.
- Greens are good for you. And this is a great roundup of the latest scholarship on brassica evolution, domestication and diversity. You’ll find most of the paper quoted in past Brainfoods.
- Grains are great. Especially with greens.
- Thank goodness for household seed banking. Especially in conjunction with the formal kind.
- All so we can breed a better peanut. And cut down more natural ecosystem?
- No, there’s community genebanks for that too…
Brainfood: Genetic erosion edition
- Crop diversity trends captured by Indigenous and local knowledge: introduction to the symposium. A whole symposium on how Indigenous knowledge reveals widespread loss of traditional crops and landraces, and the increasing adoption of high-yielding varieties, driven by economic, political, climatic, and sociocultural forces.
- Landraces and climate change: global trends through the lens of political agroecology. Structural forces (markets, policies) and unequal power in seed systems drive the decline of traditional varieties and marginalize Indigenous and local knowledge about crop diversity; climate change not so much.
- Smallholders farmers defying global genetic erosion: documenting 60 years of peanut landrace conservation in a South American diversity center. Well, not everywhere. I wonder why…
- Farmers hold diverse and connected values towards crops. The global literature shows that farmers value crops not just for yield and profit, but for a wide range of interconnected economic, agronomic, ecological, social, and cultural reasons that vary across farming systems, and recognizing these diverse values can improve research and policy on agricultural sustainability and crop diversity. So that’s why.
- Towards a holistic framework: Exploring the relationship between seed security and food security dynamics among smallholder farmers in Chimanimani, Zimbabwe. The link between smallholder seed and food security is complex, non-linear, and shaped by socio-economic, environmental, and policy factors, showing that having secure access to seed does not automatically translate into food security and that context-specific, systemic approaches are needed to understand and strengthen both.
- The local crop varieties (farmers’ varieties) registration system in Nepal: Past, present and future. It may all be very complex, but legally recognizing and protecting farmer-developed landraces within a formal seed regime can empower farmers, conserve agrobiodiversity, and strengthen seed system resilience.
- Leveraging Earth Observation Technologies to Monitor Essential Genetic Diversity. Nah, we can do it from space.
Another chance for Bambara groundnut
Yesterday’s Nibble on the annoyingly always-on-the-verge-of-breaking-through Bambara groundnut had me rummaging through the blog’s archives. Among dozens of references, I came across a post from almost 15 years ago that included some maps — of genebank accession localities and the distribution of the crop. On a whim, I downloaded the Genesys data and fed it into the maw of ChatGPT, asking it to identify gaps in the world’s ex situ holdings. For each of the top 10 priority collecting regions, I then asked for a best-bet locality for exploration. ChatGPT obliged with a KML file, which I then looked at in Google Earth, together with the accession localities.
This is the result.
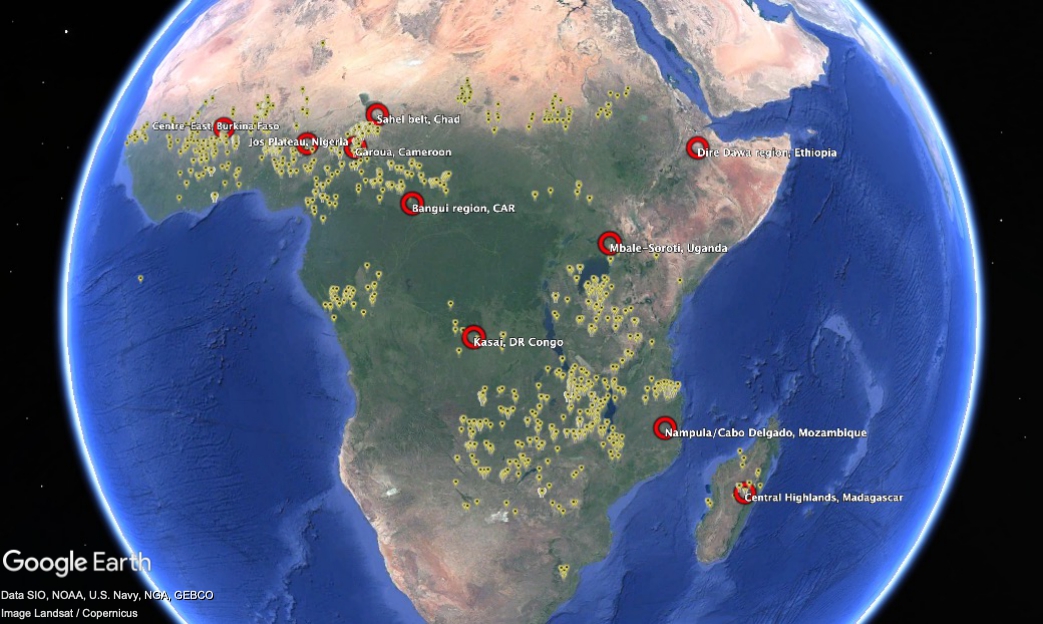
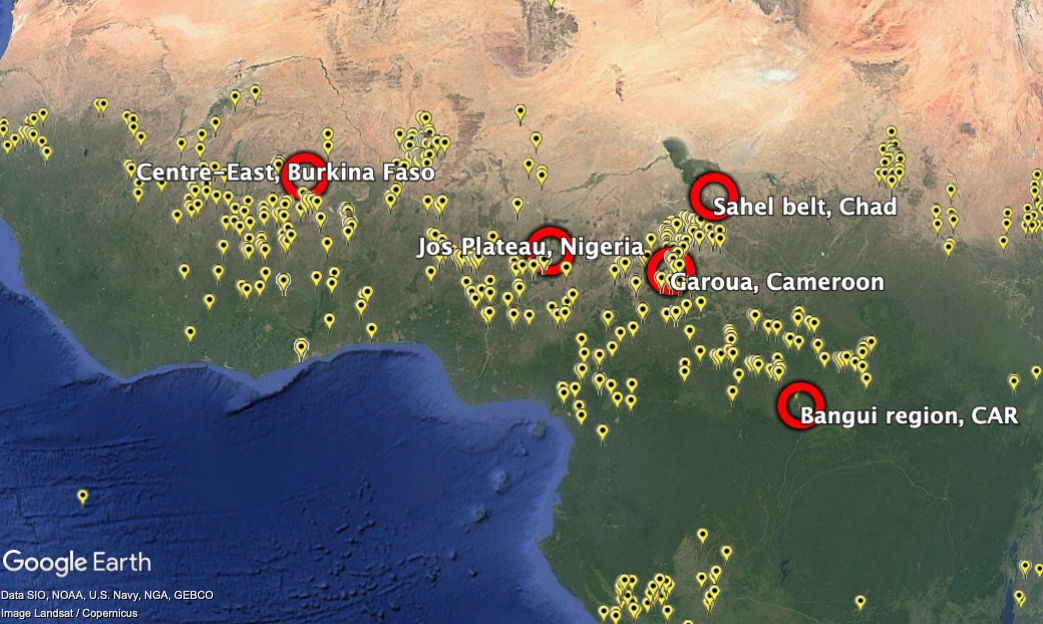
And here’s close-up on West Africa, because that’s where accessions are densest, and the suggested “gaps” a little more difficult to understand.
Asked for a justification, this is what the LLM came up with.
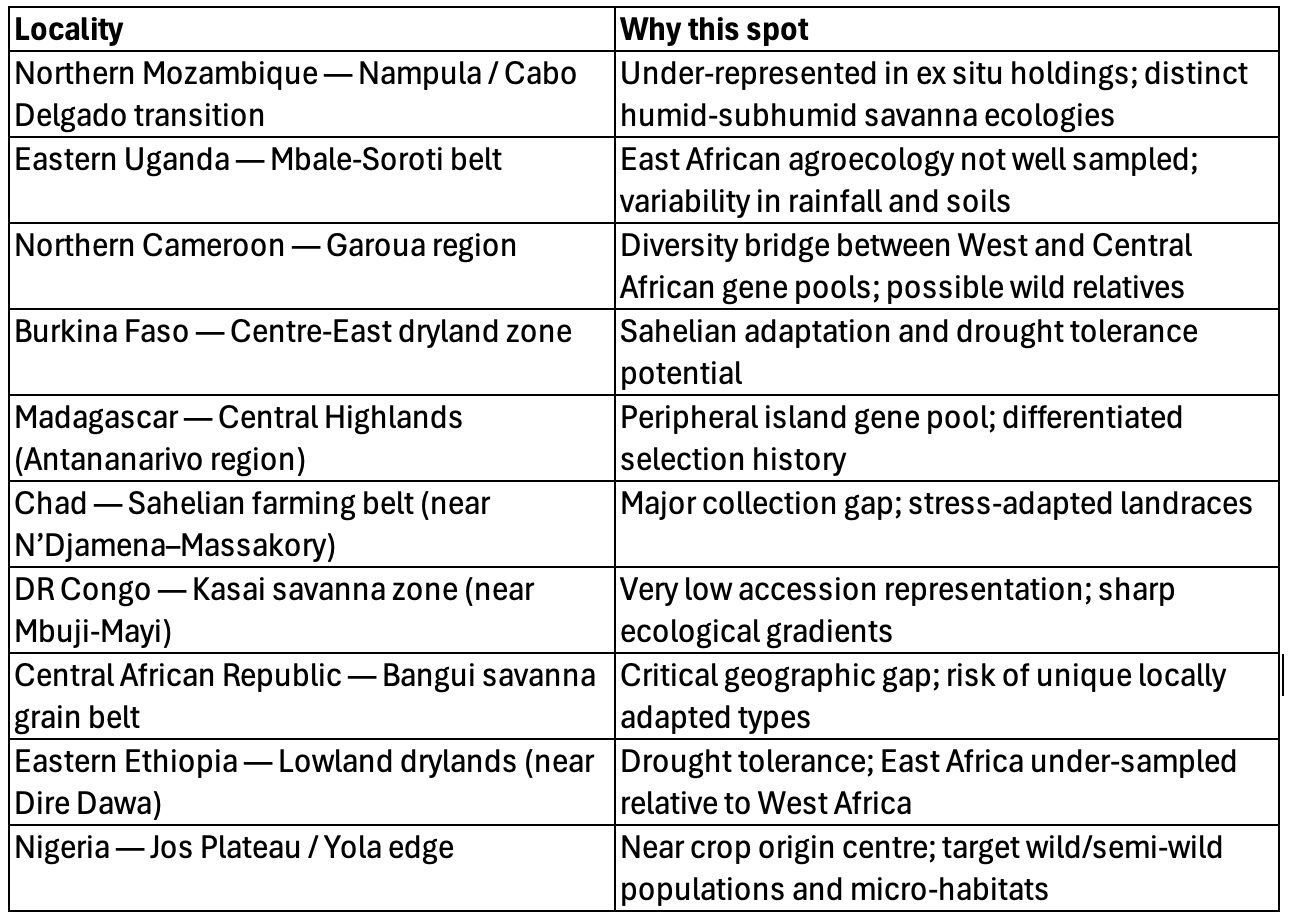
Does it make any sense? Well, it’s not exactly where I would have plumped for, just eyeballing the data. But it is not complete nonsense. Maybe it was the prompt? Any ideas what that should look like to get the best results?
Not that any of this is going to help Bambara groundnut much, I suspect.