- Rust boffins meet in St Petersburg. Good luck to them: sounds like they’ll need it.
- Did 3000-year-old rice really sprout in Vietnam? Nah.
- Indian farmers queue up for old rice seeds. Not old as in the Vietnam case above though.
- And more rice. Did the Chinese really use the sticky kind in mortar 1500 years ago? Yep.
- More ancient technology. This time Mayan rubber.
- “…a major leap forward in species-area relationship fitting…”: where will future habitat loss wreak the most havoc on plant species? And on crop wild relatives?
- The pulses of Africa. Well, a couple of them.
Nibbles: Yams, AnGR, Intensification
- One of the top 10 species described in 2009 is a yam. Yeah, I didn’t believe it either.
- ILRI video on why it’s important to conserve livestock genetic diversity.
- Edible Geography does the sort of deconstruction of Radical Cartography’s agricultural history maps that I was hoping to do but probably wouldn’t have been able to.
Spatially explicit conservation
The May 2010 Diversity and Distributions is a special issue on “Conservation biogeography — foundations, concepts and challenges.” I haven’t had a chance to go through it all, but there are very interesting-looking contributions on how to improve niche model, the role of citizen science and the biogeography of climate change. More when I actually read a couple of the papers.
Nibbles: Mapping islands, Palm diversity, Niche models
- A Global Island Database for all you GIS geeks.
- African palms threatened by climate change: sensitive to climate, but constrained in their movement.
- But careful, it is easy to overestimate extinction risk when playing around with climate suitability models.
Gulf oil spill not much of a threat to one crop wild relative
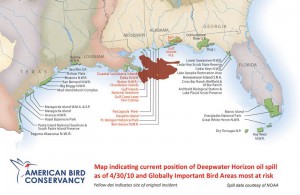
The Gulf oil spill is threatening some Globally Important Bird Areas, according to the LA Times:
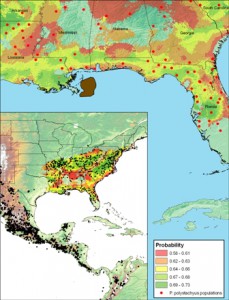
And other protected areas too. Unfortunately, we don’t have a similar map for crop wild relatives, at least not just yet, at least not so easily available. So it’s hard to estimate the overall threat posed by the oil spill on these genetic resources — which are arguably of greater importance than most birds, but there you go. What we can do — just about — is look at the distribution of individual species. And that is what our friend Julian at CIAT has done for a wild bean, Phaseolus polystachyus.
Not in any particular danger, though one or two coastal populations may be affected, I suppose. But I just wonder if one day the LA Times will publish a map showing the Globally Important Crop Wild Relative Areas threatened by some calamity or other.

