- New Gene Conservation is out. Put out more flags.
- Biofuel from coffee grounds? Right. Hope the stuff was shade-grown, anyway.
- Is a lupin or date palm seed the oldest ever found? Let the controversy rage.
- Bees scare caterpillars as well as pollinating plants. Thankfully, Europe is on the job, colony-collapse-wise.
- Trouble for Scottish farmed salmon. And the wild ones may have their problems too. But aquaculture in general is booming, they say.
- Google Earth discovers forest. Not agrobiodiversity, but fun nonetheless.
- “It doesn’t just take in seeds – it sends them out.”
- Maize pest will love climate change. Well, some of them anyway.
- The latest review of earthworms discussed.
- Jellyfish and chips?
- Eating local pretty much unavoidable in Cuba. Yes, everyone wants to be a locavore these days.
- Japanese amateur botanists get into genebanking.
- “108 dishes based on jackfruit and seed varieties that are facing extinction were also exhibited at the festival.” 108?
- Queensland markets its tropical produce via a new website. No reason why others shouldn’t do the same, is there?
- “People shouldn’t underestimate how important a goat can be for a family in Africa.” Having had to assist in slaughtering one over Christmas, I certainly don’t.
- A rapid run-through the history of chocolate.
- Long-fallow agriculture in Mali leads to more, more diverse and taller trees.
- Global accessibility map published. Also one of fires, and intact forests. Let a thousand agrobiodiversity mash-ups bloom. Thanks, Andy.
- Nepal has lots of medicinal plants. Funny they don’t seem to feature in the Western Terai Landscape Complex Project.
Portal on India’s Biodiversity
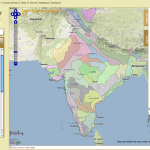
 There’s been a bit of buzz on the intertubes recently about a shiny new portal on India’s biodiversity. At last, it is live, and I have had a preliminary play with it. The first thing to say is that it is very, very slick. The information is well presented and appears quickly. The second thing to say is that while there is definitely some information there about things agricultural, it is a little high level at the moment. But that could easily change. The portal is open source and open to users, so people who really know about farming in India can get in there and make it their own, with reports from the field, performance data, and who knows what else.
I wonder whether it would be possible to give them layers (I believe that’s the technical term) of information about, say, genebank accessions, or predicted climate changes, or crop suitability, or …
Book of the agrobiodiversity of Guatemala published
My good friend Cesar Azurdia has alerted me to the publication of the book Guatemala y su Biodiversidad. Chapter 9 focuses on agricultural biodiversity. There’s a lot of great stuff on homegardens, crop wild relatives, effects of climate change etc., all subjects very dear to our heart here.
Nibbles: Coffea, Tequila, Livestock wild relatives, Rice wine, Vit. D, Statistics
- Wild coffee studied; report from Madagascar.
- Adding value to tequila. Lots of value.
- Vietnamese farmers go wild.
- Vietnamese farmers get drunk.
- All about Vitamin D.
- “…cranberries are the neglected stepchild of the season.”
- What does that make the turkey?
- Gates Foundation moves into space. Via.
Crop maps of Russia and its neighbors
I have often looked for detailed crop distribution maps for the countries of the former Soviet Union and found these hard to come by. Not any more! There is a fabulous on-line atlas of agriculture in Russia and neighboring countries.
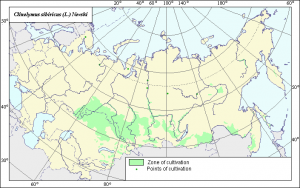
It has descriptions and maps for a 100 crops, including potato and wheat of course, but also lesser known niceties as the Snowball Tree, Sea Bucktorn and Winter Squash. The maps are pretty, here is an example for Siberian Wild Rye (you know, Siberian Black-eyed Susan; Clinelymus sibiricus (L.) Nevski). Better still, they will be available for dowload in GIS format next year.

There are also entries for 540 wild crop relatives and other agriculturally relevant plants, and for pests, diseases and weeds.
Awesome.