Mapping nutrition research

The Leverhulme Centre for Integrative Research on Agriculture and Health (www.lcirah.ac.uk) and the University of Aberdeen are embarking on an interesting project for the UK’s Department for International Development.

The objective of the project is to map the growing research activity on agricultural interventions to improve nutrition in low-middle income countries and identify “gaps” in current and anticipated research.

You might like to consider contributing information if you are undertaking or planning research with a

focus on an interaction between agriculture and nutrition, such as agricultural interventions to improve nutrition and their evaluation, the influence of agricultural practices and food value chains on nutrition, governance and policy processes through which agriculture and nutrition are linked, and links between agricultural productivity and/or growth and nutrition at a macro scale etc.

The people to contact are Corinna Hawkes (corinnahawkes “at” o2.co.uk) and/or Rachel Turner (rachel.turner “at” lshtm.ac.uk). It could be your research, or research you know about. Or indeed relevant networks (mailing lists, online fora, communities of practice) you participate in.

No doubt someone will eventually mash up the results with all the clever maps now available on HarvestChoice‘s recently revamped website.

The cutting-edge MAPPR, for example, enables users to pick and choose among hundreds of “layers” of map-based information about all aspects of smallholder agriculture in Africa—from poverty to rainfall—and make customized maps and summary tables.

But more on that tomorrow. Stay tuned…

LATER: It occurs to the blogger, belatedly, that “to map” has more than one meaning. Ooops.
Mapping some life

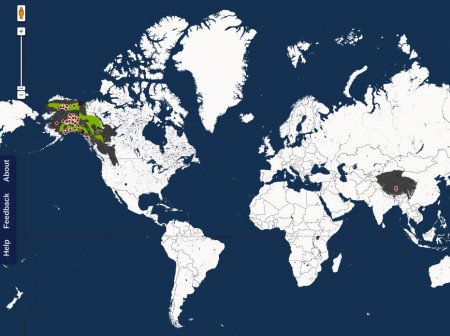
Yes, indeed Map of Life is indeed live, as we Nibbled yesterday, at least for amphibians, birds, reptiles, mammals and fish. 1 MoL pulls in point data from GBIF, of course, but also polygon distribution maps from IUCN, user-uploaded maps, local inventories from various sources and the regional checklists from WWF. That’s a whole load of different sources, formats and types of data to be served up in one googly visualization. Quite impressive. Which does make one wonder why one is reduced to screengrabs to share the results, as for example below for the yak and Dall’s Sheep, two of the high altitude mammals we featured a few days back. No doubt they’ll sort that out.

And we of course also look forward to the inclusion of plants, and in particular crop wild relatives, in the near future. We can point them to some data sources for those…

Nibbles: Environmental health index, Data visualization, Hungry World, Vegetables meeting, FFS, ICTs in ag, ILRI review, Devil’s claw, Cassava pests, Greek seed meet, Dolphins

Mapping the 1970 corn blight

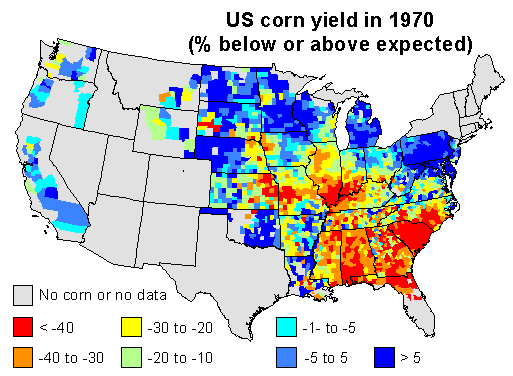
Here are my 2 maps 2 for this discussion. I used linear regression to predict corn yield for each county in the US, using time (year) as the independent variable. I used the years 1950 to 1969 to create the model, and to predict corn yield in 1970. This should be a reasonable estimate of the ‘expected yield’ for 1970 for each county, if it had been a ‘normal year’.

I then computed the difference between the expected yield and the yield obtained by farmers, and expressed that as the percentage of the expected yield. Negative numbers mean that yields were lower than expected in a county, positive numbers mean that they were higher than expected. Counties with data for less than 9 years were excluded.

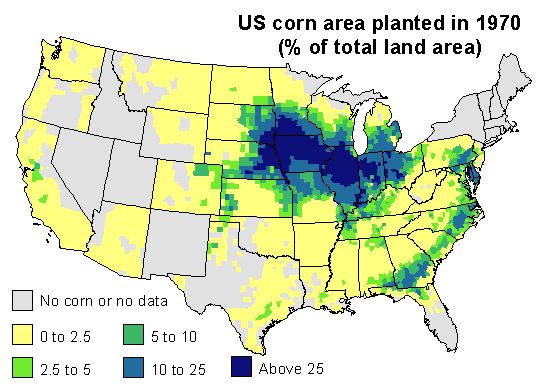
1970 corn yields were indeed much lower than expected in the southeast. Corn blight hit very hard. But also note that yield was stable or up in the north and in the west, and look were US corn was grown in 1970. The map below expresses corn area as the percentage of the total area of a county.

Most corn is grown in the corn-belt. The southern parts of it were much affected by the disease (The Illinois Secretary of Agriculture’s estimate that, by August, 25 percent of his state’s corn crop had been lost to the blight may have been spot on). But 1970 was a normal or good year for corn yield in the northern and western parts of the corn belt, and that compensated for the losses incurred elsewhere. If you sum it all up, corn production was about 15% lower than what could have been expected. That is whole lot of corn — but perhaps not that exceptional as far as bad years go.

Here is a table of estimated corn yield by state, as percentage of the expected yield for 1970, and the corn area, as percentage of the national area (only for states with more than 1% of the national corn area in the counties data set).

State Yield Area   State Yield Area
Florida -36 1   Minnesota -12 8
Georgia -33 3   Missouri -11 5
Illinois -31 18   Nebraska -9 9
Indiana -27 9   North Carolina -5 2
Iowa -26 18   Ohio -1 5
Kansas -24 2   Pennsylvania 0 2
Kentucky -22 2   South Dakota 6 4
Michigan -12 3   Wisconsin 15 3