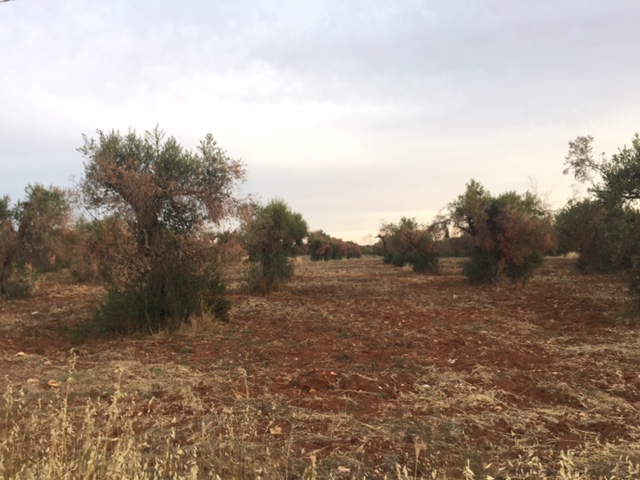
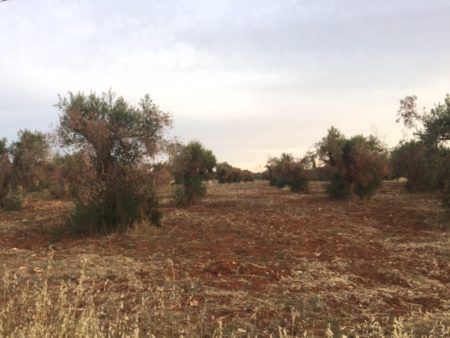
Mapping crops: Are we there yet?

I ran across a bunch of nice crop maps on the internet ((Though there are some strange things about a couple of them. Check out the shea one, for example.)), so I made a GIF for you (click on it to get it cycling).

You’re welcome.

I’m reliably informed the source is Monfreda et al. (2008). You can download the data in multiple formats, but I don’t think I’ve ever seen the headline maps displayed all together as The Decolonial Atlas has done, albeit without attribution, which is naughty.

Anyway, people have obviously taken the trouble to download and play around with the data. For example, they have been ably mashed up by Bioversity to get a global crop diversity map.

Which, in turn, it is instructive to compare with the one from the Lancet Planetary Health map we blogged about a few days ago.

But which dataset to use to do this kind of stuff? Monfreda’s is only one of many.

I see that we now, after a long wait, have WordClim 2, thanks to the work of our friend Robert Hijmans and his colleagues. ((Not to mention climate surfaces going back 20,000 years.)) Is it too much to hope for that he’ll now turn his hand to producing the definitive crop distribution dataset? ((Yes, we’ve blogged about this before. More than once.)) Maybe something for the CGIAR’s Big Data Platform, just launched, to think about organizing, convening, and/or inspiring.

Brainfood: Canola model, Saline dates, High rice, Perennial wheat, European cowpea, Mesoamerican oil palm, Seed viability, Citrus identity, Poor cassava, Horse domestication, Wild tomatoes, Tea genome, Veggie breeding, Classical brassicas

EucarpiaGR2017: better late than never

Oh gosh, I forgot to give the obligatory shout-out to the EUCARPIA meeting, this year on “Mobilizing the green gold of plant genetic resources.” Silly me. Follow what’s left on #eucarpiaGR2017, there’s some really interesting stuff on.

LATER: Oh, and compare and contrast with this:

Nibbles: Rice in Trinidad, Sweet potatoes in Ethiopia, EU crop diversity double, Sir Peter on the ginkgo, Forages, Brazilian peanuts, Seed moisture, Phenotyping double, Svalbard deposit, CATIE data, Herbarium double, Seed #resistance, Father of the apple, Agave congress

Mapping the Indian collection

Always happens this way. No sooner do I find something interesting, that something similar turns up. Case in point my post last week on the Seedlot Selection Tool. It was just a few hours after I happened across the SST that I ran into NBPGR’s PGR-Clim. Ok, it’s not quite the same thing, but almost.

PGR-Clim maps out the Indian genebank’s holdings of chickpea, pearl millet, pigeonpea, sorghum and wheat on a background of rainfall and temperature now, in the 2020s and in the 2040s.

For example, here’s what the pigeonpea collection looks like relative to todays’s temperatures.

And this is relative to the temperature in the 2040s.

So it is possible now to find a pigeonpea accession with the sort of climatic (or soil) adaptation you need, and request it from NBPGR. All you need to do is locate it on one of these images (which you can download), then somehow remember where it is and find it again on the interactive map that PGR-Clim also provides, separately. If you then click on it there, you get an accession number, which you can cut and paste into the search box of PGR Portal. Hey presto!