The call of the wild

Not sure how long they’ve been available, but I’ve just learned that the new versions of the Last of the Wild maps are out. The first version is a few years old now.

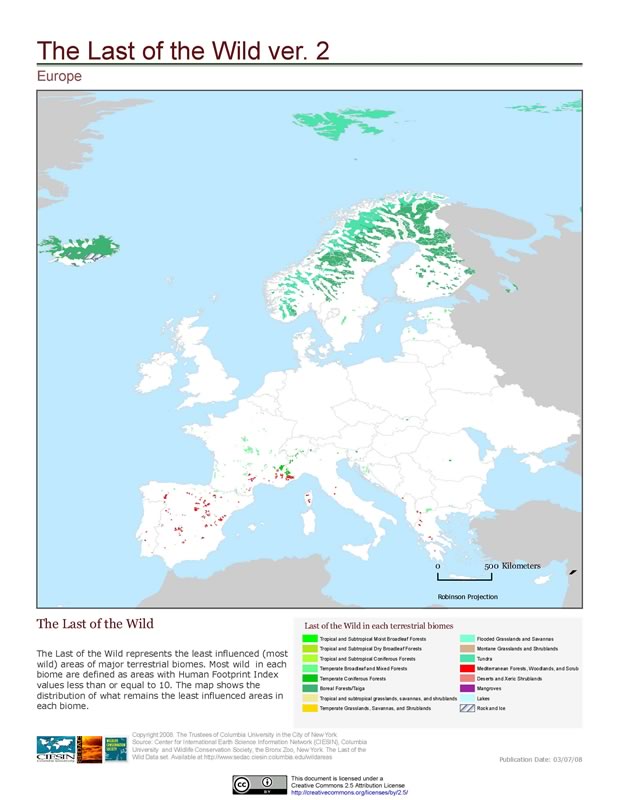
The Wildlife Conservation Society (WCS) and the Center for International Earth Science Information Network (CIESIN) at Columbia University have joined together to systematically map and measure the human influence on the Earth’s land surface today. The Last of The Wild, Version Two depicts human influence on terrestrial ecosystems using data sets compiled on or around 2000.

These are Europe’s most untouched areas:
europe

Not much left. There are also global and continental maps of human footprint and human influence index, although I must say I haven’t fully digested the difference between the two. And you can download the data and play around with it yourself, of course. Let the mashing begin!

Documenting the history of fisheries

  • Human fishing and impacts on near-shore and island marine life — including the catching of shellfish, finfish and other marine mammals — apparently began in many parts in the Middle Stone Age — 300,000 to 30,000 years ago — 10 times earlier than previously believed;
  • Passages of Latin and Greek verse written in 2nd century CE suggest Romans began trawling with nets;
  • In the early to mid 1800s, years of overfishing followed by extreme weather collapsed a European herring fishery. Then, the jellyfish that herring had preyed upon flourished, seriously altering the food web;
  • In the mid 1800s, periwinkle snails and rockweed migrated from England to Nova Scotia on the rocks ships carried as ballast — the tip of an “invasion iceberg” of species brought to North America;
  • In less than 40 years, Philippine seahorses plunged to just 10% of their original abundance, reckoned in part through fishers’ reports of each having caught up to 200 in a night in the early days of that fishery.

Just some of the insights that will be shared by participants in the forthcoming Oceans Past II conference, according to EurekaAlert. It sounds absolutely fascinating:

Using such diverse sources as old ship logs, literary texts, tax accounts, newly translated legal documents and even mounted trophies, Census [Census of Marine Life] researchers are piecing together images — some flickering, others in high definition — of fish of such sizes, abundance and distribution in ages past that they stagger modern imaginations.

It’s all part of the History of Marine Animal Populations (HMAP) project. One of the regions being studied is the Mediterranean, and the project website has some great historical photographs of fisheries, for example from the Venetian lagoon. The “scientific area” includes an erudite answer to the question “Did the Romans eat fish?” by HMAP leader of the Black Sea project Tonnes Bekker-Nielsen. Here’s a perhaps surprising snippet:

The fish product most likely to be found in the average Roman kitchen or cookshop was garum, a sauce made from fermented fish and similar to the sauce known as umami or nuac, which is very popular throughout East Asia today. Garum was used to give flavour to stews, soups and many other dishes; it could also be eaten as a relish on bread.

The project includes some interesting data visualization tools.
Nibbles: Prickly pear, Corridors, Nutrition, Backyard chickens, SW agriculture, Non-wood forest products, Mexican ungulates, Chinese sheep

Discussing threats to livestock diversity

A very informative contribution came in today from the moderator of the DAD-Net e-discussion on analyzing threats to animal genetic resources, listing a number of success stories:

1. Incentives have been used in several cases to conserve and even rescue breeds that were nearly extinct because of the reduction in population size due to the elimination by more productive breeds. Several examples are provided by the EuReCa (European Regional cattle Breeds) network in their breed of the month archive. The site for each breed also shows how breed societies can be effective in the management of AnGR. Notable cases include: Eastern Finncattle, Kerry cattle, Polish Red.

2. Exploration of niche markets through the branding of products from an endangered breed can reverse the trend of a particular breed.

3. Effect of the expansion of industrialised agriculture on indigenous breeds and how the breeds were driven almost to extinction.

4. How crossbreeding programmes (to increase productivity) coupled with unfavourable policies can be a threat to indigenous AnGR. See story on the Vechur cattle breed in India and how it was rescued from extinction.

Using photos to share knowledge about agrobiodiversity

ResourceShelf reported on a Library of Congress blog post on the photographs in the US Farm Security Administration and Office of War Information collection, the most popular among which are now available in a Flickr group under the heading FSA/OWI Favorites. That led me to some wonderful colour photos from the 30s and 40s from the same source. One of them particularly caught my eye. Not because it’s particularly well framed or for its dramatic subject matter. It’s just a pretty standard shot of some harvested oats fields in southeastern Georgia taken in May 1939. But someone — a Mr Raymond Crippen, actually, who sounds as if he has first-hand experience of wartime Georgian oat fields — has taken the trouble to annotate different parts of the image:

The most common grains in shocks were wheat, oats, barley. Farmers hated working with the barley. The “beards” stuck to sweaty arms, found their way down shirts – and they caused great itching.

This strikes me as a great way of documenting and sharing indigenous knowledge of agricultural practices and biodiversity. Has it ever been tried in a more formal way?