I ran across a bunch of nice crop maps on the internet , so I made a GIF for you (click on it to get it cycling).

You’re welcome.
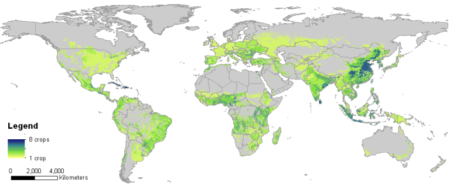
I’m reliably informed the source is Monfreda et al. (2008). You can download the data in multiple formats, but I don’t think I’ve ever seen the headline maps displayed all together as The Decolonial Atlas has done, albeit without attribution, which is naughty.
Anyway, people have obviously taken the trouble to download and play around with the data. For example, they have been ably mashed up by Bioversity to get a global crop diversity map.
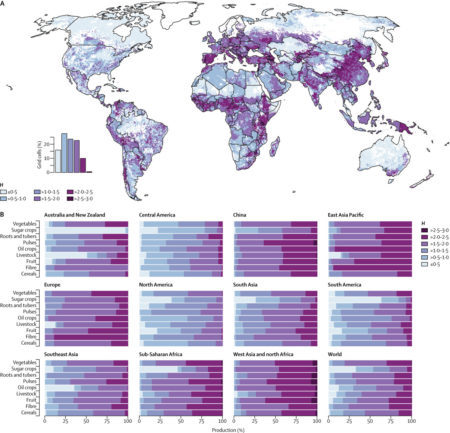
Which, in turn, it is instructive to compare with the one from the Lancet Planetary Health map we blogged about a few days ago.
But which dataset to use to do this kind of stuff? Monfreda’s is only one of many.
I see that we now, after a long wait, have WordClim 2, thanks to the work of our friend Robert Hijmans and his colleagues. Is it too much to hope for that he’ll now turn his hand to producing the definitive crop distribution dataset? Maybe something for the CGIAR’s Big Data Platform, just launched, to think about organizing, convening, and/or inspiring.