![]() There’s an awful lot of talk about smallholder farmers and how they hold the keys to food security. Talk, but not a lot of solid data. So I was intrigued to discover a new paper 1 that maps smallholdings and estimates their “contributions to global food production”. Bottom line:
There’s an awful lot of talk about smallholder farmers and how they hold the keys to food security. Talk, but not a lot of solid data. So I was intrigued to discover a new paper 1 that maps smallholdings and estimates their “contributions to global food production”. Bottom line:
[S]mallholder-dominated systems are home to more than 380 million farming households, make up roughly 30% of the agricultural land and produce more than 70% of the food calories produced in these regions, and are responsible for more than half of the food calories produced globally, as well as more than half of global production of several major food crops.
The study, from the University of Minnesota, points out the various failings of much of the existing data on smallholder farming and then takes a new and interesting approach. Household census data generally distinguishes between farming and non-farming families. So the researchers took census data from all the countries they could and looked at the smallest administrative unit in each country’s data and counted the number of households headed by someone whose primary industry was listed as farming. They mashed that up with a recent map of land cover. That gives the number of farming households per hectare of agricultural land, which in turn gives the amount of agricultural land per farming household in each of the administrative units. Bingo.
We refer to this figure as the mean agricultural area (MAA) for each unit, defined as hectares of agricultural land divided by number of farming households. While differing from traditional metrics of farm size, it is designed as a proxy for the prevalence of smaller or larger farms on the landscape.
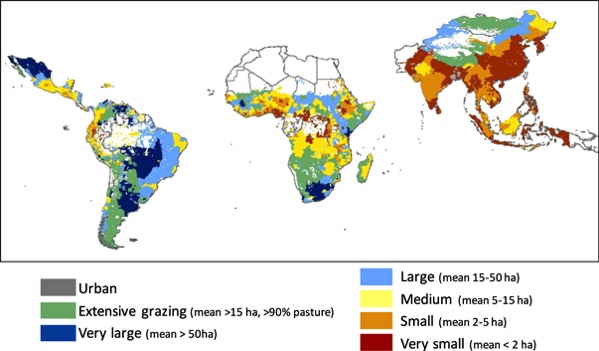
There’s a lot more manouevring and modelling but in the end they come out with a map that shows the calculated size of farms in each subnational administrative unit.
[U]nits with a MAA less than 5 hectares account for … 28% of agricultural land in the 83 countries, and are farmed by roughly 383 million households.
As for the contribution of these smaller farms to global production, that’s based on the EasthStat database, which estimates crop areas and yields by combining agricultural census data with remote sensing information. And that’s when, for me, things get a bit sticky.
Can it really be, for example, that 82% of the world’s rice, 75% of the groundnuts and 74% of the oilpalm are produced on farms smaller than 5 hectares? I suppose it must be, until a different analysis comes along.
There are lots more interesting observations in the paper, such as the observation that in Asia smallholders contribute 90% of regional food calories, while in sub-Saharan Africa the figure is closer to 50% and in Latin America less than 7%. Smallholder farms are less than 2% of the agricultural area in Latin America, so even that 7% means they’re punching well above their weight.
Given open access to the datasets, there are probably lots more nuggets waiting to be unearthed.
- Samberg, L., Gerber, J., Ramankutty, N., Herrero, M., & West, P. (2016). Subnational distribution of average farm size and smallholder contributions to global food production Environmental Research Letters, 11 (12) DOI: 10.1088/1748-9326/11/12/124010