It’s a disease that affects mostly tomatoes, more commonly known as tomato powdery mildew. It has only recently been identified as a separate species. And it is the 1000th disease to be mapped by CABI, a fact we noted from CABI’s blog.
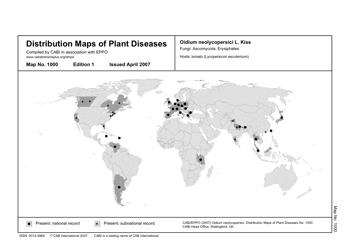
Distribution Maps of Plant Diseases is a series that has been going since 1942. To view the maps you need to subscribe, although CABI has generously made map no. 1000 available free 1. There’s also a collection of Distribution Maps of Plant Pests. Apparently, many of the maps have been drawn up more than once. What I’d really like to see would be time series animations showing how pests and diseases have moved around the world in recent years, what with climate change, air travel and a host of other contributory factors. How about it CABI?
Thanks for this suggestion Jeremy. We’d like to explain a little more about the history of the maps: we began publishing Distribution Maps of Plant Diseases in 1942 and for the first 50 or so years the distributions were drawn onto the maps by hand. Historically, when a new edition of a map was published the idea was that old editions would be replaced by the new edition and the old edition was discarded – therefore, when we digitised the maps for the first time in April 2006, we also had the job of tracking down the old editions. We have managed to get a number of them (back 10 years or so) but there are older maps out there that we have to locate, clean up and then get digitised. Part of the digitisation process involves extracting the metadata that is locked up in the map, and constructing an abstract to accompany the new electronic version. It takes time and money.
Now that the maps are digitised, the next stage is to look to do something similar to what you have suggested above as well as other developments to make the maps more usable and useful in general — we have been looking at ways of doing this and there is certainly a lot of scope for development with the technology that is out there.
In regard to the suggestion of creating time series animations showing the changing distribution of pests and diseases — it’s a great idea, but note that the maps are not revised on a regular basis but rather only if it has been brought to our attention that a revision is necessary for reasons of change of distribution or taxonomy. They are also pdf files — if anyone knows how to animate a pdf file please let us know!
If we were to make the data more dynamic, what would be a good tool for visualisation — Google Earth, NASA World Wind? Something else? If you have any thoughts and suggestions please go here and leave a comment.
We’d also like to announce that over the next few days we are going to make every 100th Map published so far, open access on the website — that way you can all get some idea of how they have changed over the years.
And finally, we’re happy to hear from anyone who has suggestions for improving and developing the maps — please contact maps@cabi.org.
Katherine Cameron – Content Editor (Env. Sci.) & Mapping Coordinator
David Smith — Business Innovations Manager
CABI
http://www.cabi.org
Hello there, I’m Jeremy’s partner over at the Agricultural Biodiversity Weblog. First of all, congratulations on a marvellous resource. May I ask how you did the digitization of the maps? Was it just a matter of scanning them to an image file or did you enter the data into some kind of GIS? Because if you’ve got the data in shapefiles, say, it shouldn’t be that difficult to animate them. Of course you could then also combine the pest/disease maps with other data, say on crop production or climate. And also mash them up with Google Earth.
Nice one. Well its obviously an advantage that the maps are being digitised, there are still many botanic jungle maps which could help global research which are still not yet digitised for botanists and scientists to access worldwide. We have recently been digitising maps of historic towns ourselves. Pearl Scan Document Scanning
We actually scan and digitise maps wuite often so if you have a few stored away we would be happy to look into the scanning of these and enhancing the images or improving the resolution for larger pictures. Pearl Scan