- Calestous Juma gives new FAO head some advice: find a role, build on what farmers do and know, engage civil society, help governments prioritize, and slash bureaucracy.
- Religion and conservation: friends of enemies?
- Eastern Africa Agricultural Productivity Project seems to be mainly about setting up regional centres of excellence in dairy, cassava, rice and wheat. Maybe ASARECA should ask for some advice from Prof. Juma?
- Land use map of the UK. Let the mash-upping begin.
- Training in sustainable conservation agriculture in India and Mexico. But how really sustainable is the whole thing if based on modern varieties? Oh, and Brazil too.
- Saving the Amazon for $33 a month.Or maybe just a buck?
- Local cooking a long way from home, Part I; from Colombia to Washington DC.
- Local cooking a long way from home, Part II; from everywhere to New York’s Lower East Side.
- Don’t worry, exploding watermelons are perfectly safe, and legal.
- FAO updates its webpage on “Implementing the Global Plan of Action for Animal Genetic Resources” and documents the fact by providing a time stamp. Jeremy chuffed.
Nibbles: Beautiful models, Beautiful bank, Organic FAO, Eskimo diet, Indian medicinals, Maya nut studentship, Fishy infographics
- Official confirmation of the need for better crop growth models.
- More on CIP’s high-tech spud bank. In other news, CIP also has banks of other Andean roots/tubers, but don’t get me started on that one.
- “FAO has relegated organic agriculture to a footnote in the discussion of food security in the long run.” Fighting talk. Wonder if that will change with the new DG.
- Cook like an Inuit.
- Cultivating medicinal plants in India. Let’s see how that goes.
- Wanna study the Maya nut?
- More great Guardian infographics, aquatic edition.
- “This one tastes like cotton candy.” Breeding strawberries the hard way.
Nibbles: Median strips, Vitamin A, Mapping in Kenya, Chaffey, Small farms, Rennell Island coconuts, Sweet potato breeding, Acacia nomenclature, Crop models, Pulque, Fruits
- Planting roadsides with natives, including crop wild relatives. And here comes the database.
- Orange Maize: The Movies.
- VirtualKenya really here. Mother-in-law beside herself.
- Plant Cuttings is out. And all of a sudden I’m in a much better place.
- Small is beautiful, farm edition. And as chance would have it, coffee farm edition. And urban edition.
- Dispute at iconic coconut plantation resolved. Apparently there are some really unique varieties there.
- I say boniato. For the first and last time.
- Acacia on the brink. Easy, tiger. The name, not the genus.
- We’re going to need a better model.
- Pulque comes back. Never knew it had gone away.
- Domesticating fruit trees in Kenya. Something for VirtualKenya?
Mapping Australian biodiversity
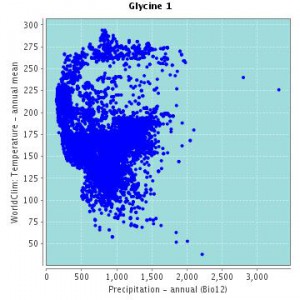
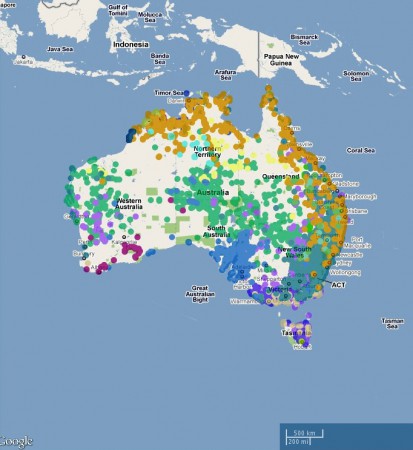
I finally got around to having a go at the Atlas of Living Australia. Very nice. You can make, and download images of, pretty maps of species distributions, Glycine in this case.
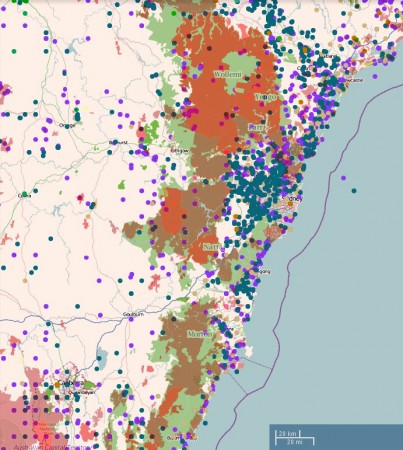
And you can mash that up with lots of different environmental layers, such as protected areas, as below.
There are nifty spatial analysis tools built in, to help you predict species distributions based on climate, for example, or explore the range of adaptation of a taxon. You can contribute to the data through citizen science projects. And much more. Well worth exploring.
What you can’t do — or at least I couldn’t find a way of doing it — is export the species distribution data to a kmz for use in Google Earth. Something I’ve complained about before for other biodiversity portals. Maybe someone out there will tell us why that is. 1
One final thing. It’s a great idea to feature a number of “themes” on the atlas website, to get people started. At the moment it is things like wattles, “iconic species” and ants. Why not crop wild relatives?
Nibbles: Cryo, Tree diversity, Agroforestry, Seed industry, Trigonella, Ancient MesoAmerica, Niche models
- CIP’s high-tech genebank.
- “The project’s eventual aim is to plant several thousand trees at sites across Perthshire to act as a ‘living gene bank.'” What, because normally genebanks are dead?
- Millennium Seed Bank joins ICRAF’s BusyTrees thing. Which you can follow in about a million different social networking ways.
- Conservation Magazine does a number on crop improvement. Wait, what? Conservation Magazine? Yep, and with teaching resources.
- Fenugreek, barkeep, and make it a double.
- Ancient chocolate and corn routes.
- What species distribution models do you like?

