- Online map of horticultural projects. Mash it up with the CGIAR map, anyone?
- Evolution and taxonomy of crop groups: Annonaceae and Allium.
- Dealing with wheat stripe in Central Asia and the Caucasus. Some good news there.
- Nigel Chaffey does his usual thing. Inimitable.
- Today’s thing on what Africa needs for this Greener or Double Green or whatever Revolution everyone wants it to have.
- Latest from FAO on what’s happening in livestock genetic resources conservation around the world.
- And the latest wonder food. I’ll pass, thanks.
- Improving capers through radiation. One of those things where you have to wonder whether it’s really all worth it.
- The genetic diversity of the Polish common hamster. Wait, what?
- Biofortified crops to the rescue. Again. Gotta wonder about overexposure. The backlash, when it inevitably comes, is going to be a doozy.
Gap-filling may be harder than we thought
Future PGRFA collections will focus on filling gaps in existing collections, collection of certain regional, minor and subsistence crops and collection from particular countries where collection has not taken place or been very limited.
That’s from the Global Plan of Action for the Conservation and Sustainable Utilization of Plant Genetic Resources for Food and Agriculture (GPA). In fact, “gap-filling” is often mentioned as a way to be more strategic and cost-efficient in germplasm collecting. This approach relies on knowing where a crop (or, more correctly, landraces of a crop) is grown, and comparing that with the distribution of germplasm accessions in genebanks (which could in fact be done in various different ways, depending on how you define “gap”, but forget that for a minute).
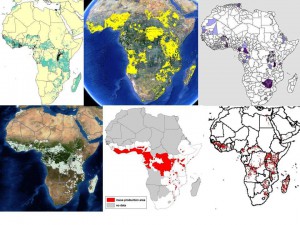
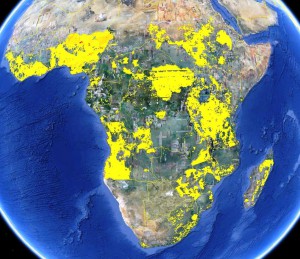
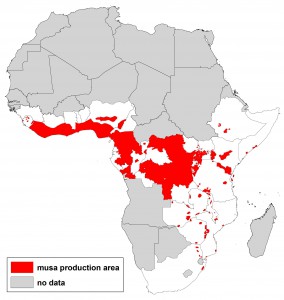
We all know about the problems associated with data on germplasm accessions (lack or inaccuracy of georeferences in passport data, for example). But in fact there are issues with the crop distribution data too, as we’ve recently discussed here and here. This shows the range of answers you get when you ask the seemingly simple question: where do bananas grow in Africa? Click on the image to see it better, or go to the previous posts.
So, is “gap-filling” a forlorn hope, at least at the continental and global levels? Looking forward to your thoughts…
Yes, we have more banana distribution data
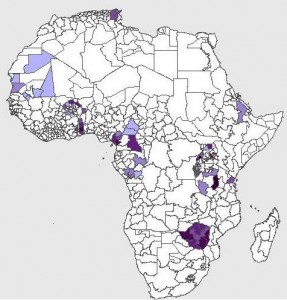
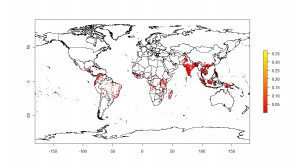 More today on where bananas grow. Or where people think they may grow, anyway. First, let’s tie up some loose ends. Yesterday I mentioned Chad Monfreda‘s dataset from the Land Use and Global Environmental Change project, but said that I hadn’t been able to get an actual map. Thanks to Julian and Andy, I now have. To the left is the result for banana.
And to the right for plantain. 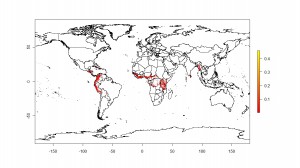
Andy also pointed me to another dataset, called MIRCA2000: “Global data set of monthly irrigated and rainfed crop areas around the year 2000.” Here’s Andy’s pragmatic take on this proliferation of datasets:
You do have information on quality and uncertainties and there is enough info — if you are interested — to work out which to use. I don’t believe that there is a right or wrong answer here, they all try to make the best of what is often very cruddy and incomplete data.
In short – you’ll have to sort it out yourself, along with the rest of us. I just take the average of these when I need to make a rice area map – though the average of a bunch of wrong datasets is still a wrong dataset.
It’s a choice between modelled crop distributions or statistical data or a combination of both. Neither is wholly accurate and like most global data sets, it is best not to look too closely at the results.
4 data sets are better than none right?
Glenn also chimed in with his work for the Generation Challenge Programme, which uses the SPAM dataset I mentioned yesterday. It’s still in beta, so you can’t play around with it yet, but, again, this is what banana in Africa looks like:
Julian sums it up very well in his very comprehensive comment on yesterday’s post, and I leave the final word to him:
This is what you’d normally expect when there’s no coordination or data sharing among institutions: you end up with several institutions, each one re-inventing the wheel. The public then does not know which source to use.
…
So, you end up with two sources of data: (1) FAO country level statistics, and (2) expert knowledge; two methods: Monfreda et al.’s and HarvestChoice’s; and one visualization tool. Anyone interested in comparing or merging?
Where do bananas grow anyway?
Where does crop X grow? Important question. And pretty simple too, no? No! Because just a little looking around yields about half a dozen different answers, and no clear idea of which to trust, or how they relate to each other, or how they were arrived at, or even if there are more.
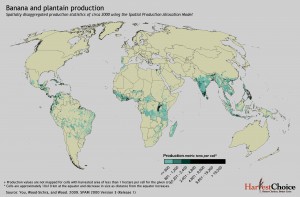
Here’s what I came up with in only about half an hour of searching. The following are all data for banana/plantains. First, there’s MapSpaM (that would be Spatial Production Allocation Model), from HarvestChoice:
Then there’s FAO’s AgroMAPS, which has some really weird data in it. Try looking at the distribution of cassava in Africa, for example. Anyway, here’s banana, which actually looks pretty weird itself:
And then there’s CIAT’s Crop Atlas of the World. 1 That says it is based on the FAO data, but doesn’t really seem like it to me, at least not on this evidence:
In its time, CIAT has also used the dataset from the Land Use and Global Environmental Change project called “Harvested Area and Yields of 175 crops (M3-Crops Data),” but I haven’t been able to get a map of that.
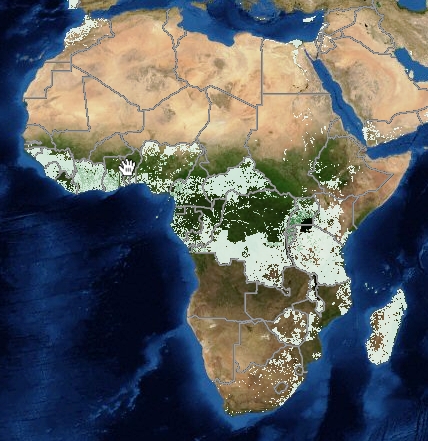
And then there’s IITA’s banana mapping effort, which admittedly is very much still a work in progress:
Well, I suppose I could sort out some of the questions I have about all this if I spent a little more time at it. But really, should a poor boy have to? Shouldn’t FAO, or the CGIAR, have all this sorted out by now? Anyone out there want to guide me through this?
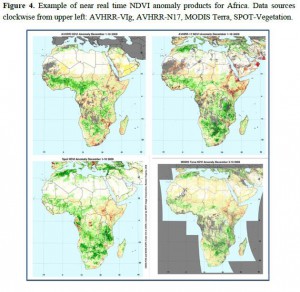
Following crop development in real time
The Global Agriculture Monitoring Project (GLAM), a joint NASA, USDA, UMD and SDSU initiative, has built a global agricultural monitoring system that provides the USDA Foreign Agricultural Service (FAS) with timely, easily accessible, scientifically-validated remotely-sensed data and derived products as well as data analysis tools, for crop-condition monitoring and production assessment.
Great for deciding on the timing of germplasm collecting expeditions too, I would imagine.
