The conventional wisdom is that landraces and local breeds are better adapted to marginal conditions than modern crop varieties and livestock breeds. A paper has just been published in Agricultural Systems that tries to quantify this. The researchers defined marginal areas “as those areas where possible land uses are relatively limited because of higher altitude, shorter growing season, steeper slopes, less fertile soils or broadly speaking because of generally lower soil productivity.” They calculated a synthetic index of marginality using all kinds of environmental and socio-economic data and mapped its value throughout Europe. They also mapped the distribution of goat and sheep breeds using data from the Econogene project. Then they calculated how good the marginality index was at predicting the presence of local breeds. The result: “Increasing marginality, as measured by these indices, is positively and significantly correlated to the fact that local, traditional breeds are present.”
Magnolias in trouble
The Global Trees Campaign says that 131 of 245 wild Magnoliaceae are threatened worldwide. According to this press release from BGCI:
The significance of this potentially catastrophic loss lies not only in the threat to the genetic diversity of the family, but also because they are a highly sensitive indicator of the well-being of the forests in which they are found. Magnolias are among the most ancient groups of flowering plants and have long been cultivated by mankind.
You can download a PDF of the new Magnoliaceae Red List. The publication of the red list has been widely covered by the press, including New Scientist. Many species have medicinal uses and some are used for food.
Predictably, protected areas are highlighted as an important approach to the conservation of these species, particularly in their hotspot in southern China. A separate new study
concludes that protected areas are necessary for preventing the loss of species due to climate change – provided that shifts in species’ ranges are factored into early analysis of whether to expand current protected areas or create new ones.
The new red list includes distribution maps of all magnolias, clearly an important first step.
Mexico atlas
If you’ve been reading this blog for any length of time you’ll know I have a thing about agricultural atlases. Well, here’s another one. Mexico’s Instituto de Geografia has put its Atlas Nacional de Mexico online, and it includes maps of crop production such as these (dating back to 1989, though). However, these are just high definition scans rather than real digital maps, which makes them slow to load and difficult to use. But beautiful to look at.
SINGER cartogram
Following my earlier post about cartograms, here’s one for the germplasm collections catalogued in SINGER, by country of origin. Thanks to Dr Robert Hijmans of IRRI for the birthday present.

Cool cartograms
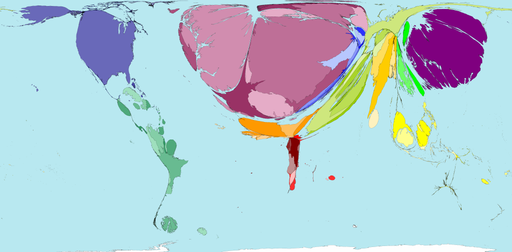
Cartograms are maps where the sizes of territories (countries, say) are proportional not to the surface area of their real-world counterparts, but rather to the value of some other attribute, like population or GDP or incidence of malaria. You can see lots of really wonderful examples on the Worldmapper website. That includes a few agricultural variables and some forestry stuff. Here’s an example of the former, net imports of vegetables by $ value.

As I said earlier in connection with Gapminder, wouldn’t it be great to be able to produce cartograms from FAOSTAT data? Or what about from the data in SINGER? Well actually that shouldn’t be all that difficult, the code for making your own cartograms is available, according to Worldmapper’s FAQ. Any volunteers?
Cartogram © Copyright 2006 SASI Group (University of Sheffield) and Mark Newman (University of Michigan), reproduced by permission. Worldmapper is at: www.worldmapper.org