- Diversity and morphological characterization of Musa spp. in North Kivu and Ituri provinces, Eastern Democratic Republic of Congo. New cultivars still being discovered.
- A review of research on the effects of drought and temperature stress and increased CO2 on Theobroma cacao L., and the role of genetic diversity to address climate change. We have the diversity. But for how long?
- Climate change adaptation of coffee production in space and time. Gonna need Plans B and C. But do we have the diversity?
- Evaluation and Breeding of Zoysiagrass Using Japan’s Natural Genetic Resources. Stick to morphology.
- Where are commodity crops certified, and what does it mean for conservation and poverty alleviation? Less for poverty alleviation than for conservation. But more and better spatial data needed, especially on organic certification.
- Environmental and geographic variables are effective surrogates for genetic variation in conservation planning. Phew!
- Genome diversity of tuber-bearing Solanum uncovers complex evolutionary history and targets of domestication in the cultivated potato. More diversity in the landraces compared to wild species than in any other crop, few genes involved in early improvement, and different loci for adaptation to uplands and lowlands; also, wild relatives involved in diversification of long-day types.
- Agricultural biodiversity is sustained in the framework of food sovereignty. Peasants feed the world.
- Crop domestication facilitated rapid geographical expansion of a specialist pollinator, the squash bee Peponapis pruinosa. Bee follows crop follows people.
- Unlocking the diversity of genebanks: whole-genome marker analysis of Swiss bread wheat and spelt. Early breeders missed some stuff.
- A probabilistic model for tropical tree seed desiccation tolerance and storage classification. Predict storage behaviour from morphology.
- Potential of golden potatoes to improve vitamin A and vitamin E status in developing countries. Here we go again.
Seeds in motion
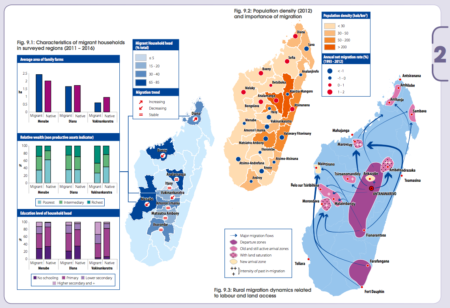
I guess it’s an occupational hazard, but whenever I see such maps, as in the new atlas Rural Africa in motion. Dynamics and drivers of migration south of the Sahara from FAO, my first question is: how many of those people are carrying seeds?
Brainfood: Rice introgression, African rice cores, Cereal domestication rates, Power vegetables, Biodiversity services, Afrikaner cattle diversity, Conservation funding
- Introgression from cultivated rice alters genetic structures of wild relative populations: implications for in situ conservation. Not totally wild any more.
- Genetic Variation and Population Structure of Oryza glaberrima and Development of a Mini-Core Collection Using DArTseq. 2,179 accessions, 5 geographic groups, 16% recover >95% of polymorphisms.
- Geographic mosaics and changing rates of cereal domestication. Applying fancy maths to archaeobotanical remains shows that selection pressures varied in time, and started slow.
- Tapping the economic and nutritional power of vegetables. Eat your veggies, damn it!
- To what extent can ecosystem services motivate protecting biodiversity? Not enough.
- Genetic diversity of Afrikaner cattle in southern Africa. 3 groups, but not geographically determined, and lots of diversity despite recent declines in numbers.
- Nominal 30-m Cropland Extent Map of Continental Africa by Integrating Pixel-Based and Object-Based Algorithms Using Sentinel-2 and Landsat-8 Data on Google Earth Engine. Next level. But when will be be able to distinguish crops?
- Reductions in global biodiversity loss predicted from conservation spending. But the impact of spending goes down with with increasing development pressure.
Nibbles: Millets galore, Human diversity & ag, Super farmers, Extinction is forever, Indian nutrition maps, Future Food competition, Banana viruses, Cassava in Brazil & Africa, Sugar book, Fairchild & Irma, Vegetable ROI, Embrapa beans, Certified coffee, Legal pot, Native American foods
- Today’s new genome is pearl millet. The most climate-smart of crops? Now, to process it more easily.
- Finger millet is not too bad either.
- Agriculture was good for human diversity, at least in Papua New Guinea. Elsewhere, maybe not so much.
- Julio Hancco Mamani grows 400 potato varieties up in the Andes (but how did it all start?). And Rahibai Soma Popere “15 varieties of rice, nine varieties of pigeon pea and sixty varieties of vegetables, besides many oil seeds” in Maharashtra.
- “West Bengal government encourages cultivation of extinct rice varieties.” Wait, what?
- Presumably not extinct like silphium.
- India’s first nutrition atlas will maybe tells us where more Rahibai Soma Poperes are most needed.
- Future Food includes seeds.
- Cleaning up bananas.
- Would love to have been on the “Brazilian Cassava Learning Journey.” Tanzania next?
- The bitter side of sugar.
- Fairchild Tropical Botanic Garden damaged by Irma.
- Research on vegetables really pays off, vegetable researchers say.
- Brazilian bean catalog launched.
- Certifying coffee seeds.
- Pot next?
- Closely followed by Navajo tea.
Brainfood: Kolli Hills diversity, Fergana diversity, Chinese rice terraces, ICRISAT prebreeding, Spanish CWR collecting, Edible flowers, Diversification, Prices vs volatility
- An ethnographic exploration of perceptions of changes in dietary variety in the Kolli Hills, India. Cassava cash cropping has had unforeseen effects on dietary diversity.
- Mapping and assessing crop diversity in the irrigated Fergana Valley, Uzbekistan. More crops on the edges.
- An Analysis on Crops Choice and Its Driving Factors in Agricultural Heritage Systems—A Case of Honghe Hani Rice Terraces System. Established for “red rice”, but that’s not enough.
- Prebreeding Using Wild Species for Genetic Enhancement of Grain Legumes at ICRISAT. It’s not easy, but it’s been worth it.
- A Multispecies Collecting Strategy for Crop Wild Relatives Based on Complementary Areas with a High Density of Ecogeographical Gaps. Collecting in Spain in “…top 10 selected complementary areas would allow the capture of 59 of the 88 targeted taxa and 31% of the 683 different taxa-ELC category combinations identified in the ecogeographical gaps.”
- Antioxidant power, anthocyanin content and organoleptic performance of edible flowers. Tycoon Blue will be quite the marketing challenge.
- Diversifying Food Systems in the Pursuit of Sustainable Food Production and Healthy Diets. And nary an edible flower mentioned.
- Cereal price shocks and volatility in sub-Saharan Africa: what really matters for farmers’ welfare? Prices.