- Role of genomics in promoting the utilization of plant genetic resources in genebanks. Genebanks don’t need to do genomics themselves to benefit from genomics.
- Improving the Yield and Nutritional Quality of Forage Crops. Case in point.
- Genomic variation in 3,010 diverse accessions of Asian cultivated rice. Case in point. Multiple independent domestications. Tomorrow, the world.
- Sweet potato dispersal or human transport? Maybe no evidence one way or another after all. Rebuttal of: Reconciling Conflicting Phylogenies in the Origin of Sweet Potato and Dispersal to Polynesia. And the counter to the rebuttal. This genomics stuff not so easy after all.
- Review: Meta-analysis of the association between production diversity, diets, and nutrition in smallholder farm households. It’s not always there. But that would have been a high bar.
- Agricultural diversification as an important strategy for achieving food security in Africa. Case in point. More diverse households and farming systems are more food secure, but only up to a point, and it depends on various factors. 43% of African cropland will be difficult to diversify.
- Using herbaria to study global environmental change. Have been used to monitor the effects of climate change, habitat change, pollution and invasives on plants.
- Green Digitization: Online Botanical Collections Data Answering Real‐World Questions. Gotta get the stuff digitized first though.
- The ‘PhenoBox’, a flexible, automated, open‐source plant phenotyping solution. Somebody mention digitizing?
- Dissecting the null model for biological invasions: A meta-analysis of the propagule pressure effect. The success of aliens is down to their numbers. Wonder if it works for pest and disease organisms too.
- Are systematic reviews and meta-analyses still useful research? We are not sure. All righty then. Scrap the above.
- Shattering or not shattering: that is the question in domestication of rice (Oryza sativa L.). From one of the authors, Debarati Chakraborty: Loss of shattering through sh4 is not a crucial step for rice domestication. Genetics, cultural anthropology and archaeology suggests that primitive agrarians were dependent on wild or semi-domesticated shattering rice.
- Rooting for food security in Sub-Saharan Africa. Sub-Saharan Africa probably hasn’t the rootable soil depth for monster maize yields.
More on cassava germplasm from Brazil
You might remember a post from a couple of weeks back comparing the localities of cassava accessions in Genesys (mostly conserved at CIAT) with cultivation of the crop in Brazil. I ended that little piece with the observation that when data from the national genebank system of that country finally makes its way into Genesys, which should not be long now, it will be possible to really figure out where the gaps are in the “global” collection of the crop. Well, as it happens, there was a Tweet just recently which included a photo of a map of where Embrapa’s cassava accessions come from:
Embrapa has collected germplasm from throughout the Amazon region and has characterised this using 20,000 SNPs. Main disease problem is soft rot during heavy rains in this rainforest zone. Working on identifying pathogens & finding genes linked to resistance @IITA_CGIAR @embrapa pic.twitter.com/7go8eipUhn
— James Legg (@jamesplegg) April 28, 2018
So, quick as a flash, I imported it into Google Earth as an image overlay, and after much fiddling to make it fit on top of the background provided by GE (only partially successfully), was able to compare it with the accessions in Genesys:
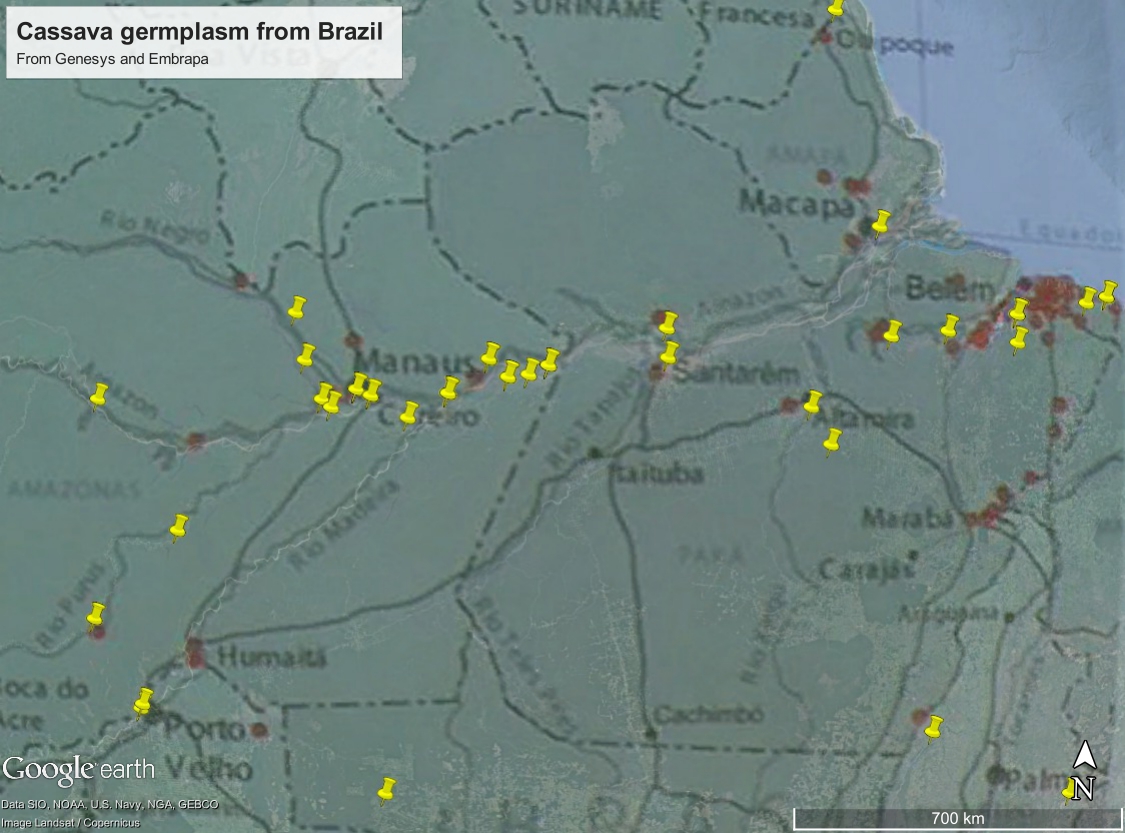
The two sets of accessions (red for Embrapa, yellow for CIAT) look nicely complementary at a glance. Maybe the gaps in one collection are adequately covered by the other, and vice versa (which of course then brings up the issue of safety duplication, but that’s another post). Or maybe not: this is a really crude way of looking at the data. But it does point to the importance of data sharing and the need for collaboration among genebanks, national and international.
Brainfood: Definitions, Atlantic goats, Sorghum photoperiod, Maize erosion, Dactylis diversity, Chickpea diversity, Social media, TR4, Diet change
- ‘Genetic resources’, an analysis of a multifaceted concept. You don’t say.
- Exploring the genetic diversity and relationships between Spanish and Moroccan goats using microsatellite markers. Different, but connected, except for the ones in the Canary Islands.
- Latitudinal Adaptation of Flowering Response to Photoperiod and Temperature in the World Collection of Sorghum Landraces. Out of 20,710: 1697 photoperiod and temperature insensitive, 18,766 photoperiod sensitive and temperature insensitive and 247 photoperiod and temperature sensitive.
- Conserving maize in gene banks: Changes in genetic diversity revealed by morphological and SSR markers. Not good ones.
- AFLP-based genetic diversity of wild orchardgrass germplasm collections from Central Asia and Western China, and the relation to environmental factors. Strongish ecogeographic structure. Good to see old school markers still in use.
- Genetic Diversity, Population Structure, and Genetic Correlation with Climatic Variation in Chickpea (Cicer arietinum) Landraces from Pakistan. Some differentiation along elevation and temperature gradients despite limited overall diversity.
- Capturing genetic variation in crop wild relatives: An evolutionary approach. Environmental data is your friend. But we knew that, right?
- New Geographical Insights of the Latest Expansion of Fusarium oxysporum f.sp. cubense Tropical Race 4 Into the Greater Mekong Subregion. Be afraid.
- The opportunity cost of animal based diets exceeds all food losses. Never happen.
- An Introduction to Social Media for Scientists. It might happen, if you tweet it.
- Tweet success? Scientific communication correlates with increased citations in Ecology and Conservation. See what I mean?
Brainfood: Seed libraries, Nepali veggie seeds, Agricultural ES, Zn rice, Sub rice core, SoD, D2N, Root crops knowledge, Horse diversity
- Civic seeds: new institutions for seed systems and communities—a 2016 survey of California seed libraries. 6456 seed packets borrowed annually, by 4776 people, from >100 seed libraries, with a 6% return rate.
- Vegetables production and marketing: practice and perception of vegetable seed producers and fresh growers in Nepal. Producers like hybrids, consumers prefer open pollinated varieties. Oh, and drying is a problem. No word on whether seed libraries might help.
- Exploiting ecosystem services in agriculture for increased food security. Services don’t include crop diversity, apparently.
- Molecular Diversity Analysis for Zinc Deficiency Tolerance under Aerobic Rice (Oryza sativa L.) Ecosystem. Two major groups.
- Developing Mini Core of Rice Germplasm for Submergence Tolerance. Really mini. Maybe too mini?
- CIMMYT’s Seeds of Discovery Initiative: Harnessing Biodiversity for Food Security and Sustainable Development. A “visionary investment.”
- Temporal change of Distance to Nature index for anthropogenic influence monitoring in a protected area and its buffer zone. I want a Distance to Genebank index.
- Indigenous knowledge and household food security: the role of root and tuber crops among indigenous peoples in the Northern Philippines. The youth are losing it.
- Decline of genetic diversity in ancient domestic stallions in Europe. It was artificial selection during the Iron Age.
Yes, we have plenty of banana information
I’ve come across a number of banana-related resources lately, so I thought I’d pull them all together in one post.
First, there’s CropMapper.org, from Bioversity, which “aims to collect, to make available and to share spatial information on global banana production in a single centralized database.”
Then there’s “Banana natural biodiversity mapping,” from iNaturalist. It’s objective is “to map the distribution of CWRs and landraces in primary and secondary centers of diversity” through crowdsourcing. Which I suppose could eventually be added to the more conventionally sourced data in the CWR Atlas.
And finally there’s blog post from IITA describing a project to document banana diversity in the Democratic Republic of Congo using morphological traits that have been overlooked in the past. I assume the data will find its way into the Musa Germplasm Information System. And thence to Genesys.
All these contribute to answering a question that I asked here back in 2010: Where do bananas grow anyway? What I still don’t see, though, is a way to bring all this information together in one place.
And, given that there’s collecting going on as we speak, for example, the information — and the need — will only grow:
Researchers from the Meise Botanic Garden (Belgium), Plant Resources Center (Vietnam) and Millenium Seed Bank (UK) are in northern Vietnam to study and collect wild bananas. Follow their progress at #banana_expedition_2018. https://t.co/FIVObVECRS
— ProMusa (@promusa_banana) April 19, 2018