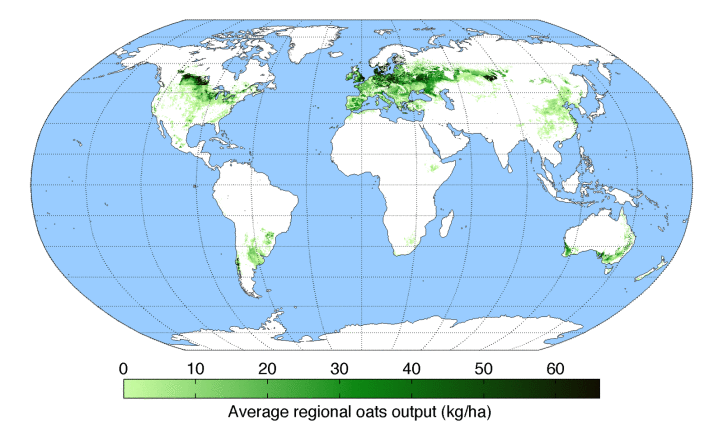
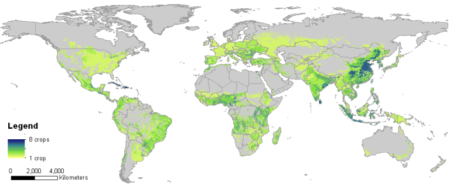
In reply to our plea for a definitive crop distribution dataset, Andy Nelson, who used to work at IRRI and is now at the University of Twente, had this to say in a comment.
Well, this may be one way to go.
Compiling the best expert information with subnational statistics as a first cut and then using that to guide further detailed mapping with remote sensing/big data.
I’d like to see more efforts in crowdsourcing for crop mapping as well.
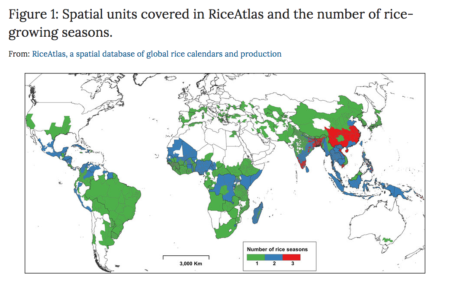
“This” is “RiceAtlas, a spatial database of global rice calendars and production.” 1
Because of the need to develop a spatially explicit global database of rice calendars that includes detailed information on rice areas with more than one rice crop in a year, we compiled the most detailed available datasets of rice planting and harvesting dates by growing season in all rice-producing countries, and linked the database to subnational production data. ‘RiceAtlas’ provides a spatial and seasonal distribution of the world’s rice production. RiceAtlas contributes to the GEOGLAM (Group on Earth Observations Global Agricultural Monitoring) initiative and regional partnerships, such as the Asian Rice Crop Estimation and Monitoring initiative (Asia-RiCE), by providing information for agricultural monitoring requirements, satellite data acquisition plans, and global crop outlook.
Here’s what it looks like.
With regards to crowdsourcing, there are various initiatives out there that could be relevant, including Geo-Wiki‘s Field Size Campaign.
Anyway, no doubt the RiceAtlas will eventually end up on the website of the CGIAR’s Consortium for Spatial Information. One bit of this, the SRTM 90m Digital Elevation Data, made a recent list of Top 15 Free GIS Data Sources.