- “…the world’s first environmental health index to be based on long term historical data” not actually as interesting as it sounds.
- Data porn. Aggregated. There oughta be a law… Speaking of infoporn, though, check out the third one here.
- AlertNet site on Solutions for a Hungry World pretty but broken. Media alerted, so by the time you read this they may have fixed it and you won’t get Haiti no matter what you click.
- Warwick meeting to look at vegetables and food security. You going? Will you tell us about it?
- Farmer field schools in El Salvador. Diversification seems to be on the curriculum. But diversity?
- And are they using — or being taught — ICTs?
- ILRI reprises a high-impact article. And why not. Nice idea, actually. I may steal it.
- Devil’s claw: weed or NUS? Both!
- Cassava not such a Rambo after all? Heading for a quagmire in SE Asia.
- Greek seed savers met a couple of weeks back. Where you there? Would you like to tell us about it?
- Speaking of seeds, would you like to help save the D. Landreth Seed Company?
- More social dolphins more likely to help humans fish. I wonder if the same for, say, ancient wolves.
Mapping the 1970 corn blight
Here are my 2 maps 1 for this discussion. I used linear regression to predict corn yield for each county in the US, using time (year) as the independent variable. I used the years 1950 to 1969 to create the model, and to predict corn yield in 1970. This should be a reasonable estimate of the ‘expected yield’ for 1970 for each county, if it had been a ‘normal year’.
I then computed the difference between the expected yield and the yield obtained by farmers, and expressed that as the percentage of the expected yield. Negative numbers mean that yields were lower than expected in a county, positive numbers mean that they were higher than expected. Counties with data for less than 9 years were excluded.
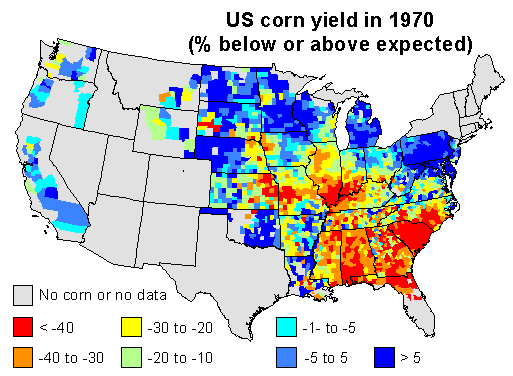
1970 corn yields were indeed much lower than expected in the southeast. Corn blight hit very hard. But also note that yield was stable or up in the north and in the west, and look were US corn was grown in 1970. The map below expresses corn area as the percentage of the total area of a county.
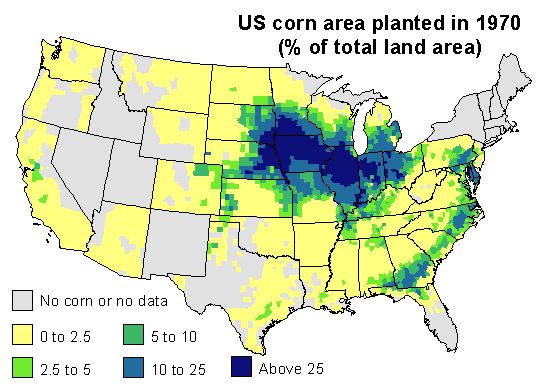
Most corn is grown in the corn-belt. The southern parts of it were much affected by the disease (The Illinois Secretary of Agriculture’s estimate that, by August, 25 percent of his state’s corn crop had been lost to the blight may have been spot on). But 1970 was a normal or good year for corn yield in the northern and western parts of the corn belt, and that compensated for the losses incurred elsewhere. If you sum it all up, corn production was about 15% lower than what could have been expected. That is whole lot of corn — but perhaps not that exceptional as far as bad years go.
Here is a table of estimated corn yield by state, as percentage of the expected yield for 1970, and the corn area, as percentage of the national area (only for states with more than 1% of the national corn area in the counties data set).
| State | Yield | Area | State | Yield | Area | |
|---|---|---|---|---|---|---|
| Florida | -36 | 1 | Minnesota | -12 | 8 | |
| Georgia | -33 | 3 | Missouri | -11 | 5 | |
| Illinois | -31 | 18 | Nebraska | -9 | 9 | |
| Indiana | -27 | 9 | North Carolina | -5 | 2 | |
| Iowa | -26 | 18 | Ohio | -1 | 5 | |
| Kansas | -24 | 2 | Pennsylvania | 0 | 2 | |
| Kentucky | -22 | 2 | South Dakota | 6 | 4 | |
| Michigan | -12 | 3 | Wisconsin | 15 | 3 |
Nibbles: Genomic data, Seed porn, Ancient Amazonian ag, Genebanks Down Under, Climate data porn, Fiber in Maine, REDD+ at the CBD, Colony Collapse Disorder, Chili porn, Seed systems
- GBIF makes its move.
- Homaging the seed.
- Learning sustainability from old Amazonian farmers. Really old. Really, really old.
- Yet another Aussie genebank. Or maybe the same one, I’ve lost track. And interest.
- Where climate data comes from.
- Maine’s fiber community, what, exposed? Unveiled? Uncovered? And similar from Bolivia.
- REDD+ will save us all.
- Don’t crack open the mead to celebrate the solution to colony collapse disorder just yet.
- All things Capsicum on one handy website.
- Whole bunch of policy briefs on African seed systems. Don’t know if I’ll ever have the time to read through the lot, but cursory perusal suggests the following bottom line: the market can’t do it all by itself.
Nibbles: Commons, Tom Wagner, CGIAR, Domestication presentation, Sophisticated urbanites, Vavilov’s potatoes in the news, Perennial crops, African drought, Aegean lathyrism, Heirlooms
- The vocabulary of the commons.
- An interview with Tom Wagner, a great tomato and potato breeder.
- The CGIAR Consortium has a newsletter, with bits in it about what they’re doing on agrobiodiversity, genebanks (such as this one), all that stuff. But I guess news of this big Africa-wide food security project came in too late. Oh, here’s another one, on ICRISAT’s new chickpea.
- Pat Heslop-Harrison on domestication. I am reliably informed he once extracted DNA from a fruit smoothie using nothing but household utensils and cleaning chemicals. Pat, is there a video?
- Urban ag in the Philippines. For some reason, there’s been a ton of this sort of urban food stuff on the tubes lately. Like this for instance. And this (compare current orchards in London with historical ones). I may just have to blog about it. Oh dear, I just have.
- The Glasgow Herald heralds the importance of Vavilov’s potatoes.
- Long post with lots of different bits of info on lots of perennial crops.
- Monitoring drought in Africa via pretty maps. And more pretty maps in search of a use.
- Ancient Aegean lathyrism? Dirk alerted.
- A keeper of seeds does his stuff near Pittsburgh.
Nibbles: NERICA vs landraces, Asian breeding, Wild wheat threats, Indian agrobiodiversity area, GBIF, Ancient Amazonia
- NERICA shmerica.
- Did you know that the Society for Advancement of Breeding Research in Asia and Oceania (SABRAO) 12th Congress from 13-16 January 2012 in Chiang Mai, Thailand. No, neither did I.
- Whither wild wheat?
- Koraput and its agrobiodiversity, including aus rice, makes it on the Globally Important Agricultural Heritage System (GIAHS).
- GBIF has many duplicates. I’m shocked. Shocked, I tell you.
- Amazonia was densely populated. No it wasn’t. Yes it was. No it wasn’t.