- Selection of the most informative morphoagronomic descriptors for cassava germplasm. From 51 to 32. Hardly seems worth it. And dropping descriptors can be dangerous.
- Advances in core collection of plant germplasm resources. In Chinese, alas, but it sounds intriguing.
- Trends in breeding oat for nutritional grain quality – An overview. You want high β-glucan, and you can get it by breeding for high yield, luckily. A. atlantica has high β-glucan.
- Indigenous Fruit Trees of Tropical Africa: Status, Opportunity for Development and Biodiversity Management. Need for “exploiting the under-tapped treasuries of IFT.” Still? People have been saying that for years. They’ve even designated agroforestry systems as globally important and everything.
- Promoting Santalum yasi Seeman (Sandalwood or yasi) in agroforestry systems to reverse agrodeforestation in Fiji. An attempt to introduce a high value species into a threatened agroforestry system. Not just fruit, then.
- Genetic diversity and population structure of wild/weedy eggplant (Solanum insanum, Solanaceae) in southern India: Implications for conservation. Quite a lot of geneflow.
- The potential for crop to wild hybridization in eggplant (Solanum melongena; Solanaceae) in southern India. Transgenes from the crop could spread to the wild relative.
- Variation in Antioxidant Activity and Flavonoid Aglycones in Eggplant (Solanum melongena L.) Germplasm. So, the leaves are good for you. But I suspect they taste like crap.
- The Qingyuan Mushroom Culture System as Agricultural Heritage. Would pay money to see that.
- Selecting High Amylose Rice Germplasm Combined with NIR Spectroscopy at the RDA Genebank Conserved. From 9481 to 14 with high amylose and decent agronomy. But why bother?
- Field response of chickpea (Cicer arietinum L.) to high temperature. There are some heat tolerant lines in the ICRISAT genebank.
- Genetic diversity in East African finger millet (Eleusine coracana (L.) Gaertn) landraces based on SSR markers and some qualitative traits. The diversity is high, mainly within countries, and missing from the ICRISAT minicore. Naughty.
- Analyses based on the 16S rRNA and secA genes identify a new phytoplasma subgroup associated with a lethal yellowing-type disease of coconut in Côte d’Ivoire. The international genebank is threatened.
- New Insights into Capsicum spp Relatedness and the Diversification Process of Capsicum annuum in Spain. Limited genetic diversity has differentiated in Spain into pungent, elongated peppers in the South and Center, and sweet, blocky and triangular types in the North.
- Knowing native potatoes: finding local experts through innovative methods in the Peruvian Andes. Community Biodiversity Register methodology applied to potato landraces. Don’t see anything much new here, but good to have it nicely documented.
Nibbles: Biltong, Coco de mer, PGRFA course, Poplar genebank, IRRI genebank, African agriculture, Hybrid chickens, American food
- Professor wants to copyright the name biltong, should be forced to eat nothing else until he takes it back.
- Getting to the bottom of coco de mer.
- PGRFA course at Wageningen. Expensive, but worth it, and you can apply for a NFP/MENA Fellowship, check on the course overview PDF.
- The IRRI genebank manager has seen the future of genebanks: “…we need to work on building the system to estimate breeding value from genotype, and then we will be able to feed more detailed knowledge to the breeders.” He probably means DivSeek. Now IRRI really need to get a different stock image of him and his genebank.
- The UK now has a National Black Poplar Clone Bank. Not quite as big as the above.
- A different take on Bill’s Big Bet. And more along the same lines.
- Hybrid Kuroiler chickens a big hit in Uganda. Bill may be onto something after all.
- “As American as apple pie” is just the beginning. I want to see Kuroilers at KFC.
Bottleneck slides
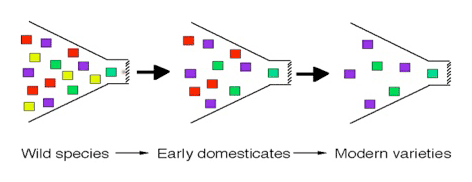
Try and find an illustration of the domestication bottleneck — to put in a slide for a presentation, say — and likely as not you end up with some variation on a classic theme, this particular version being from the great Teacher-Friendly Guide to the Evolution of Maize:
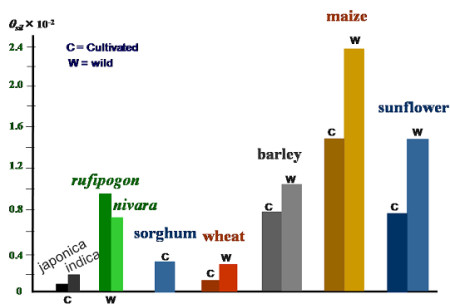
That’s fine for some purposes, but sometimes you want real data, and then you might use this:
But I don’t really find that particularly striking, do you? And that’s why I really got excited about Fig. 1c in a recent paper about patterns of genomic diversity in a bunch of soybean accessions, ranging from wild populations to modern varieties. It’s really tiny in the paper, so I’ve blown it up here, at the expense of some quality:
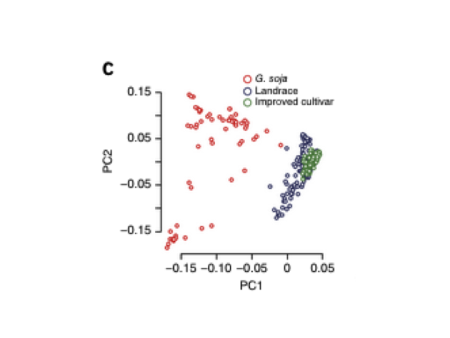
I think this really shows very compellingly how the genetic diversity space shrinks and shifts as you move from wild soya to modern varieties. You don’t even really need to know that the axes are principal component scores or indeed how diversity was measured. But is this kind of diagram common out there? I can’t remember seeing anything quite this clear, and some rapid googling drew a blank too. Well, perhaps I read the wrong journals.
So here’s a question for you: what’s your favourite illustration of the domestication bottleneck, using real data? If we get a decent number of examples, I’ll try to put them all together in a post, and maybe even organize a vote.
Nibbles: Food security course, Food foodprint infographic, Ganja genomics, Hop hope, French collections, Forest control, Australian poppies, Paraguayan resistance, Cacao improvement, Hot pepper, Endogenous viruses, Biofortification
- Our Hungry Planet: Agriculture, People and Food Security. Free online course from University of Reading.
- What if people in country X ate the same diet as people in country Y?
- The Man wants to fingerprint your stash.
- Or maybe fragrantly hopped beer is your poison?
- A new one on me: Conservatoire des Collections Végétales Spécialisées (CCVS).
- All politics is local. All control of forestry enterprises ought to be.
- Victoria takes to the poppy. Afghanistan unavailable for comment.
- The small farmers of Paraguay holding back the flood of soy. Or trying to.
- The promise — and curse — of CCN 51. And some context on the whole peak chocolate thing.
- Wait, some people think Bhut Jolokia is a cool name?
- The grapevine has gone viral. Millions of years ago.
- Global Panel of Wise Agricultural People says to biofortify your crops.
Nibbles: Taro recipes, Pawpaw Kickstarter, Pica, Slow seeds, Forest foods, Pork rises, Landscapes, Best friend, Cooking & CC
- Ok, now you have no excuse not to eat taro.
- Do your bit to help pawpaws (Asimina triloba) go viral. No, wait, that didn’t come out right.
- “Pica is an unexplainable food curiosity—the overwhelming desire to eat the inedible.” Or, as we say in my house, German food.
- Tuscan seed journey.
- Living off forest foods can be fun.
- Pork beats beef.
- Picturing the Earth. Some of it ain’t pretty. But even then it’s pretty.
- Picturing working dogs. All of them pretty.
- Kenyan chef Ali L’artiste tucks into Rwandan bananas and beans before it’s too late.