- Iron beans in Rwanda: crop development and delivery experience. 800,000 households, discontinuation rate 11%. But the health outcomes? Too early, I guess.
- Phylogenetic origin of limes and lemons revealed by cytoplasmic and nuclear markers. It’s so VERY complicated.
- Seed producer cooperatives in the Ethiopian seed sector and their role in seed supply improvement: A review. Sitting between the formal and informal seed systems, they “play a key role in meeting seed demand and contribute greatly to seed supply improvement through high-volume production of seed, crop, and variety diversification, and seed delivery to farmers.”
- Gamification of farmer-participatory priority setting in plant breeding: Design and validation of “AgroDuos”. Based on pairwise ranking. I remember doing it by hand, but it’s nice to have the app. And there’s more.
- Emerging Avenues for Utilization of Exotic Germplasm. It comes down to the collections being better characterized and understood.
- Genetic resource policies in international collaborative research for food and agriculture: A study of USAID-funded innovation labs. Transaction costs are rising. Well, yeah.
- Plums: A Brief Introduction. Will keep you regular.
- Characterization and phylogenetic analysis of ancient Italian landraces of pear. Some synonyms found, some unknown things identified. All very worthy.
- Genetic diversity and a population structure analysis of accessions in the Chinese cowpea [Vigna unguiculata (L.) Walp.] germplasm collection. The Chinese stuff is different to the African stuff.
- Out of Borneo: biogeography, phylogeny and divergence date estimates of Artocarpus (Moraceae). Yeah but how many can you eat?
- Effective seed harvesting strategies for the ex situ genetic diversity conservation of rare tropical tree populations. “…fewer seeds from each of a larger number of trees, … from peripheral subdivided regions of the population.”
Brainfood: CWR use, Mainstreaming, Duplicates, Phaseolus model, Cherimoya diversity, Legume mixtures, ICRISAT pearl millet, Taste breeding, Rhubarb rhubarb, Plasticity, Seed dispersal
- The Use of Crop Wild Relatives in Maize and Sunflower Breeding. In maize, unlike sunflower, it just hasn’t been worth it. Yet.
- Securing sustainable and nutritious food systems through mainstreaming agricultural biodiversity: an interdisciplinary study. What works in Brazil won’t necessarily fly in India.
- Duplication assessments in Brassica vegetable accessions. Half of 13 accession pairs/triplets with identical names from VIR and NordGen turned out to be morphologically identical.
- Beans (Phaseolus ssp.) as a Model for Understanding Crop Evolution. 7 independent domestication “events” spread across 5 species and 2 continents makes for some interesting natural experiments.
- A Mesoamerican origin of cherimoya (Annona cherimola Mill.). Implications for the conservation of plant genetic resources. Compare and contrast with above.
- Highly productive forage legume stands show no positive biodiversity effect on yield and N2-fixation. Sometimes diversity doesn’t add much.
- Genetic Resources of Pearl Millet: Status and Utilization. 22,888 accessions from 51 countries. Indian landraces: earliness, high tillering, high harvest index and local adaptation; African: bigger panicles, large seed size, and disease resistance.
- Use of natural diversity and biotechnology to increase the quality and nutritional content of tomato and grape. Both are needed.
- Rhubarb (Rheum species): the role of Edinburgh in its cultivation and development. From China, via Russia, with love.
- Will phenotypic plasticity affecting flowering phenology keep pace with climate change? If the change is smaller than about 13 days.
- Seed dispersers help plants to escape global warming. Because they move seed >35 m per decade uphill.
Nibbles: Wheat-barley hybrid, Father of Wheat Revolution, Medieval bread, Tomato history, SOWP2, Domestication, Red Data, Taro benefits, Hummus!, Textile book, Healthy rice, Avocado Wars
- Tritodendrum hits the market.
- DS Athwal would have approved. RIP.
- Medieval bakers too, I bet.
- Want some cherry tomatoes on your bread? No? Try these then.
- Lots of crop wild relatives among newly discovered plants. See (some of) them on the new State of the World’s Plants report from Kew. And no, Kew, none of them are “miserable.”
- Early farmers unintentionally produced vegetables with larger seeds simply by cultivating them. And cereals too.
- Head of IUCN Red Data List Unit in impassioned plea for IUCN Red Data List process.
- What is taro good for? I’m glad you asked.
- I missed International Hummus Day? How could this happen?
- Textilia Linnaeana! What do you mean I’ve just had my birthday?
- Lowering the glycemic index of rice for the Chinese market.
- Fighting for avocados. Literally.
Indian nutrition and crop diversity link ready to be explored
Is there a relationship between levels of stunting in Indian districts…
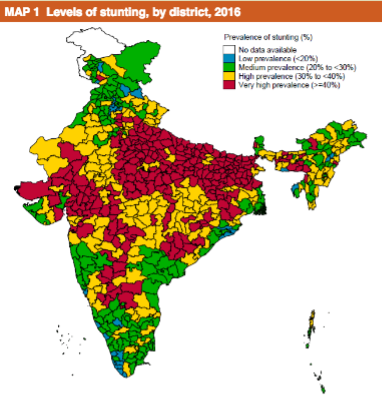
…and crop diversity in their farming systems (blue low, green high)?
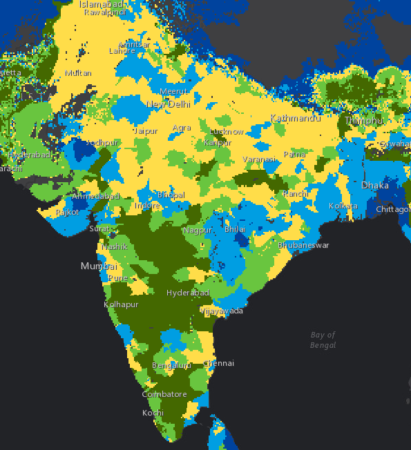
I have no idea. But I think we should be told.
Genetic erosion: it’s complicated
From the CIAT blog:
Putting true numbers on diversity loss turns out to be a complicated and contested business, with no shortage of strong opinions. One big part of the problem is that there aren’t many good ways to count the diversity that existed before it disappeared. Researchers have done some work to assess the changes in diversity in crop varieties of Green Revolution cereals, and to some degree on the genetic diversity within those varieties. The results indicate that, although diversity on farms decreased when farmers first replaced traditional varieties with modern types, the more recent trends are not so simple to decipher.
My work here is done.