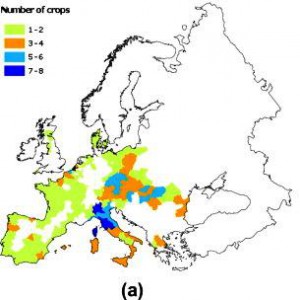
 A recent paper in Agricultural Systems looks at what’s happened to the potential yields of eight crops (winter wheat, spring barley, maize, winter rapeseed, potato, sugar beet, pulses and sunflower) in Europe from 1976 to 2005. Italy and central and eastern Europe have been the big losers (left), probably due to higher temperature increases, sometimes in combination with lower radiation values.
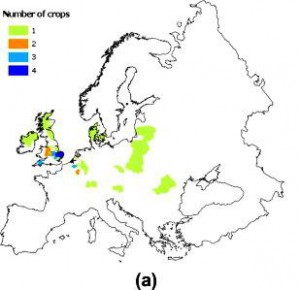
 And the British Islands have been the big winners (right), due to to longer period during which temperature is optimum for CO2 assimilation, sometimes in combination with higher radiation levels. That, of course, cannot last forever, though.
Hello Luigi,
Thank you for posting this, it really looks interesting. Unfortunately I am not sure I fully understand the two plots. The legend says ‘number of crops’ but this is not enough for me to understand which areas are more at risk and why. Do you have any additional information?
Thanks
Carlo
The “number of crops” refers to the proportion of the 8 crops considered whose potential yields have either gone up or down over the study period.