![]() Thanks to a Facebook post, I’ve just come across the “mapoteca digital” of CONABIO, the Comisión Nacional para el Conocimiento y Uso de la Biodiversidad of Mexico. 1 It has point maps of the distribution of both wild and cultivated beans and calabazas, and of wild maize; but most interesting to me were the maps of the distribution of the richness of cultivated maize races, based on collections made at different times in the past. The data were put together by the “Proyecto Global de Maíces” (2006-2010), and the maps are also available in a PDF.
Thanks to a Facebook post, I’ve just come across the “mapoteca digital” of CONABIO, the Comisión Nacional para el Conocimiento y Uso de la Biodiversidad of Mexico. 1 It has point maps of the distribution of both wild and cultivated beans and calabazas, and of wild maize; but most interesting to me were the maps of the distribution of the richness of cultivated maize races, based on collections made at different times in the past. The data were put together by the “Proyecto Global de Maíces” (2006-2010), and the maps are also available in a PDF.
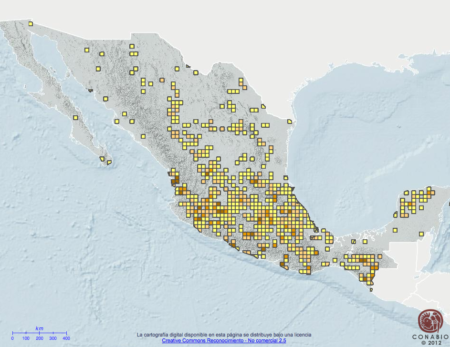
Here’s the map for 1940-1965, based on about 3,000 collections.

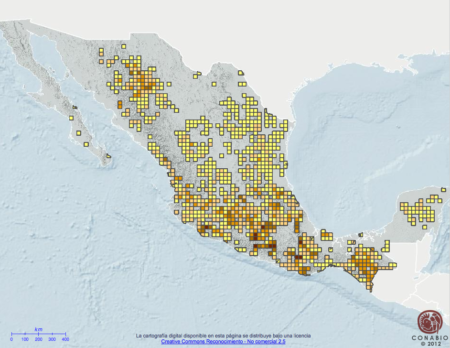
And here’s the map for 1991-2000, based on 12,000 collections.

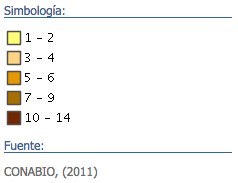
 The legend used in both maps is at the left here. Looking at the maps, lots of questions came to mind. Why are we getting higher numbers of races in the 1990’s? Is it that the collecting was more thorough then? Or are races moving around more now? There is lots of information on the individual races on the project website, including actual and potential distribution maps. And you can download the raw data. So another thing that came to mind was that surely someone must have gone through all this stuff in detail. And sure enough, yes someone had indeed gone through all this stuff in detail, Peralta & Golicher in 2014. 2
The high rank correlation between the three collection efforts indicate that relative abundance of races has not changed considerably since 1950. Races that were common in 1950 were also common in 2005, and the same can be said for rare races, none of these were apparently more common in 1950. Correspondingly, the comparison of distribution and richness models for the three sampling efforts does not suggest a general decline in richness nor in distribution for 43 of the 47 races studied, and in the other four cases the declines are relatively minor and require verification. The recent increase in distribution for two races (Tuxpeño and Celaya) may be explained by the outstanding importance these have had as components in commercial cultivars, it is not uncommon to find recycled and creolized landraces that had their origin as commercial seeds. Also, no extinctions were reported for the 47 races studied since all were sampled in the last collection effort between 1997 and 2010. Therefore, in a broad sense, at the race level of classification we do not find signs of substantial genetic erosion between 1943 and 2010. That is not to say no losses of local populations have occurred.
I can’t for the life of me understand why I haven’t blogged about this paper before (or indeed the project that generated the data), bringing together as it does two of my very favourite things, agrobiodiversity and mapping 3, but I’m more than happy to rectify that oversight here and now. I can’t help thinking there’s more to be mined from this dataset yet.
- Which, incidentally, has one of the coolest street addresses ever.
- Perales, H., & Golicher, D. (2014). Mapping the Diversity of Maize Races in Mexico PLoS ONE, 9 (12) DOI: 10.1371/journal.pone.0114657
- Quite apart from undermining the genetic erosion narrative.
¿que te pasa calabaza?