More reading to do, damn. Thanks to Jacob for finding a pointer to Kyoto Journal’s Biodiversity Edition. It includes a special section on satoyama, a hymn to the attractions of biodiverse diets, and a paean to seedbanking. Among many other things. Meanwhile, there’s also the new issue of Biodiversity Informatics, which focuses on the digitization of natural history collections. When am I going to be able to get any work done?
Nibbles: Nepal genebank, Banana mapping, PNG diet, Climate change
- More on the inauguration of the new Nepal genebank.
- Someone else thinks crop production maps might be useful in prioritizing germplasm collecting. No, wait…
- Diverse diets are good for you. Well I never. No, it’s always good to have the data.
- Andy Jarvis feeds reptiles climate change facts shock.
Nibbles: ABS, Climate change and crops, Beer proteome, Cattle SNPs, Nepal genebank, Sceletium tortuosum, CBD, Weeds, Vitamin A
- Indian academics voice some reservations about CBD ABS regime. Maybe a multilateral approach would be better?
- CIAT warns about climate change effect on crops. Kenyan farmers know all about that. And Koreans too. Oh, and speaking of kimchi…
- Beer proteome means better beer. Fundamental research indeed.
- Cattle breeds are real. And the gaur?
- Nepal inaugurates genebank.
- San benefit from bioprospecting license for medicinal plant.
- Ahmed Djoghlaf says…
- Weeds? Not weeds. Cities as biodiversity hotspots? Oh I give up.
- Orange cassava due to one amino acid.
Climate change winners and losers in Europe: the story so far
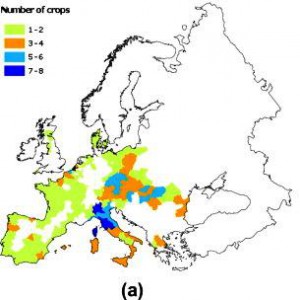
 A recent paper in Agricultural Systems looks at what’s happened to the potential yields of eight crops (winter wheat, spring barley, maize, winter rapeseed, potato, sugar beet, pulses and sunflower) in Europe from 1976 to 2005. Italy and central and eastern Europe have been the big losers (left), probably due to higher temperature increases, sometimes in combination with lower radiation values.
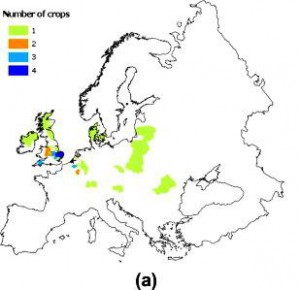
 And the British Islands have been the big winners (right), due to to longer period during which temperature is optimum for CO2 assimilation, sometimes in combination with higher radiation levels. That, of course, cannot last forever, though.
Nibbles:Collecting missions, Grapes, Beans, Genome, Local markets, Water
- From GBDBH, a light glimmers: browse and search records of crop collecting missions.
- “Variations in early-season temperatures may alter substantially grapevine yield formation.” For Cab Sauv at any rate.
- Mixture of beans as good as resistant variety against anthracnose disease.
- Genome inversion spurs ecotypic differentiation.
- A review of medicinal plant markets.
- Today’s huge global dataset: “threats to human water security and freshwater biodiversity in global river systems.”