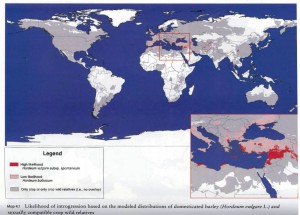
I’ve just received a copy of “Gene Flow Between Crops and Their Wild Relatives” by Meike S. Andersson and M. Carmen de Vicente (Johns Hopkins). This will no doubt become the go-to reference book on the subject. There are chapters on all the major crops, with what look to me like very comprehensive bibliographies on each. Of particular interest are the maps of introgression risk at the end of the book. These will apparently be made available on the Bioversity website in due course. But here’s one (barley) in the meantime to whet your appetite.
Mapping Species Distributions previewed
Dag Endresen introduces Mapping Species Distributions by Janet Franklin, just published by Cambridge University Press.
Species Distribution Modeling (SDM) has really found its way into the scientific literature of late. It has moved from its origin in ecology, to a wider use in life sciences, including also recently data analysis in agriculture. Andy Jarvis, for one, has recently done some excellent studies of crop diversity with MaxEnt. I have not yet read this book, but have ordered it from my favorite online bookshop. Here’s why.
The book introduces the theory and the fundamentals of SDM and proceeds with a deeper description of the many different data analysis methods that has been applied. The list of methods is long (and still growing). However, it seems this book gives comprehensive guidelines for selecting the appropriate method for your own SDM study. I believe that Janet Franklin, the author, teaches species distribution modeling with the free open source R statistical analysis software. We can perhaps hope to find also some few examples of how to apply the described methods with the R package.
The books seems, however, much more focused on the understanding of the ecological principles for SDM and species-environment relationships. The large section on the SDM methods aims to provide us with an understanding of the assumptions and limitations for the models and predictions. I hope this will help to relieve the kind of “black-box” mystery I sometimes feel for many of the SDM methods. We shall see.
Janet Franklin has long experience of biogeography, with appointments as professor of both Geography and Biology.
For your bookshelf
Just a quick note on two books on subjects close to our hearts here at the Agricultural Biodiversity Weblog: climate change and agriculture, and mapping species distributions. We’ll be trying to get hold of them for review. Preferably for free. Hint hint.
Nary a drop to drink
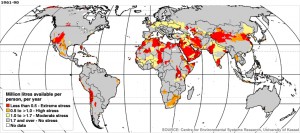
The BBC had an interesting series of maps in December last year on the effects of climate change, economic and population growth on per-capita water availability, based on the work of Martina Floerke and colleagues at the University of Kassel in Germany. Here’s the picture for 1961-90. Red is bad.
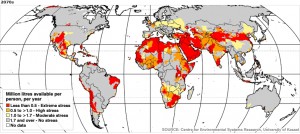
And here is the 2070s. Click to enlarge.
Doesn’t look good, particularly for Central and West Asia, and both southern and North Africa. That’s where your drought tolerant crop varieties are going to come in useful, I guess. And not just that. But I don’t understand how Australia gets away with it so lightly.
How fast will this climate change be anyway?
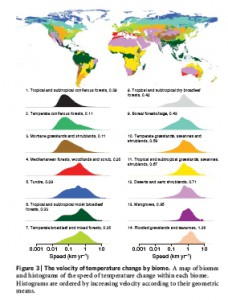
![]() Well, in terms of distance along the Earth’s surface, about 400 m per year on average, ranging from 80 m per year in mountainous regions to 1.26 km per year in deserts. That’s according to a new paper in Nature by Loarie et al. ((Loarie, S., Duffy, P., Hamilton, H., Asner, G., Field, C., & Ackerly, D. (2009). The velocity of climate change Nature, 462 (7276), 1052-1055 DOI: 10.1038/nature08649)) Compare that with figures of postglacial migration rates of <100 m per year for some trees. Here’s a map of the speed of temperature change by biome from the Nature paper (click to enlarge).
Well, in terms of distance along the Earth’s surface, about 400 m per year on average, ranging from 80 m per year in mountainous regions to 1.26 km per year in deserts. That’s according to a new paper in Nature by Loarie et al. ((Loarie, S., Duffy, P., Hamilton, H., Asner, G., Field, C., & Ackerly, D. (2009). The velocity of climate change Nature, 462 (7276), 1052-1055 DOI: 10.1038/nature08649)) Compare that with figures of postglacial migration rates of <100 m per year for some trees. Here’s a map of the speed of temperature change by biome from the Nature paper (click to enlarge).
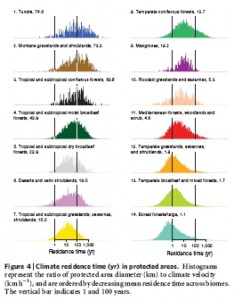
And here’s the “persistence time” for protected areas in different biomes, i.e. the diameter of protected areas divided by the climate velocity.
The persistence time — which is how long it takes for the current climate to cross a protected area — exceeds 100 years for only about 8% of protected areas. And that, dear reader, is why we need protected areas that are larger and more connected. Oh, and genebanks.
