- Economist blogger tells conservationists to stop with the hotspot mapping already, and conserve something. DIVA-GIS developers unavailable for comment.
- Some of the tea in China.
- Filipinos abandon cannabis for silk. Jeremy comments: you can smoke silk?
- Nice tree photos.
- FT does the interactive thing with rising food prices. Via. Let them eat pasta, I say.
- Wanted: more mid-sized farms to fight The Man.
- Watch out world. Mississippi set to industrialise basil production.
- Ten reasons AGRA won’t work.
- A tale of two rice-growers; how the crop has fared in Brazil and China.
- Danes meet to save seeds.
- Southern Africans meet to save seeds.
African protected areas surveyed
The EU-funded “Assessment of African Protected Areas” is out:
The purpose of the work is to provide to decision makers a regularly updated tool to assess the state of Africa PAs and to prioritize them according to biodiversity values and threats so as to support decision making and fund allocation processes.
It is great stuff: detailed, standardized descriptions of the importance of — and threats faced by — each protected area in Africa. I wonder if something similar will ever be done for agricultural biodiversity. An interesting first step might be to mash these results with those of the recent survey of crop wild relatives in protected areas. Unfortunately, the agrobiodiversity and protected areas communities hardly ever speak to each other.
Nibbles: lard, ICTs, rice maps
- Leave the mozzarella. Take the lard.
- Great post, great paper on mobile phones and the price of fish. Via.
- Rice distribution maps, current and historical.
Follow your tree in Google Earth
I agree with Frank Taylor at Google Earth Blog: it is a really good idea. You go to mybabytree.org, pay $5.50, and WWF plants a tree (you have a choice of 3 species) for you in Sebangau National Forest in Kalimantan, Indonesia, and sends you a KML file of its location. How about doing the same for heirloom varieties of fruit trees or something?
Disease hotspots mapped
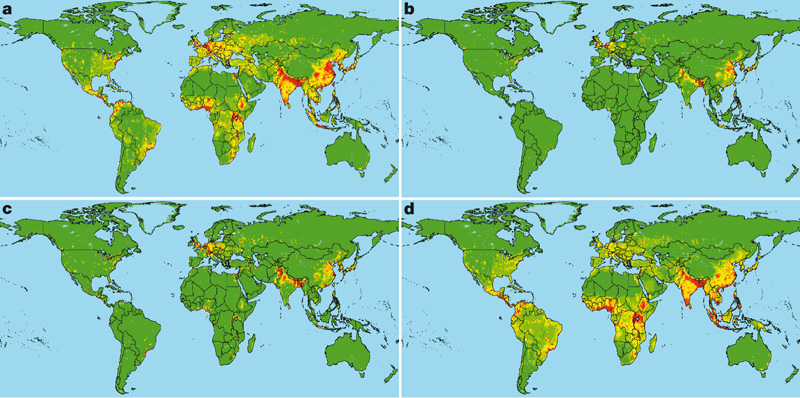
A letter in Nature this week looks at “Global trends in emerging infectious diseases.” 1 It includes some interesting maps, including these:

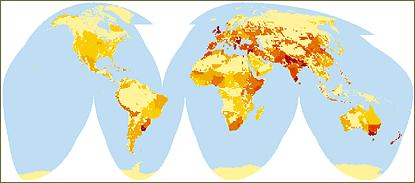
They show the global distribution of relative risk of an emerging infectious disease (EID) event caused by: (a) zoonotic pathogens from wildlife, (b) zoonotic pathogens from non-wildlife, (c) drug-resistant pathogens and (d) vector-borne pathogens. That’s based on climate, human population density and growth, and wildlife host species richness. Note in particular the map in the top right-hand corner: basically risk of zoonotic pathogens jumping to humans from livestock. Compare this livestock density 2:

Not a great match with density of domesticated animals. Maybe the correlation would be better with livestock diversity?