- Did ancient Iberians domesticate foxes?
- Myanmar genebank staff receive training in Australia.
- Why genebanks are important. Though not so much for wild rice. No, not that wild rice, we’re talking Zizania here.
- Genebanks can be community-friendly.
- Improving cowpea and banana. Need genebanks for that.
- Picturing genebanks.
- Drinking for conservation.
- Mapping tree diversity.
- Some grasses steal genes from neighbours.
- Polish hops for Polish beer.
Brainfood: Improvement recapitulates domestication, Functional variation, Intensification, Gender & nutrition, Collaboration double, Losses, AgRenSeq , Crocus domestication, Saffron evolution, Mascarene CWR, Mexican CWR, ABS, Sweet cocoa, Tasty fruits, Baobab diversity
- How can developmental biology help feed a growing population? By figuring out how domestication hacked developmental processes.
- Distinct characteristics of genes associated with phenome-wide variation in maize (Zea mays). Analyzing a lot of traits at a time identifies a different set of phenotypically causal genes than more conventional single-trait approaches. What it all means in practice I have no idea, you tell me.
- Sunflower pan-genome analysis shows that hybridization altered gene content and disease resistance. Not only is one trait not enough, one genome is not enough.
- Agriculturally productive yet biodiverse: human benefits and conservation values along a forest-agriculture gradient in Southern Ethiopia. Depends what you mean by productive.
- Does providing agricultural and nutrition information to both men and women improve household food security? Evidence from Malawi. Yes.
- Principles of effective collaboration in agricultural development and research for impact. Learn from the birds.
- Opening the dialogue: Research networks between high‐ and low‐income countries further understanding of global agro‐climatic challenges. See above. Maybe.
- The global burden of pathogens and pests on major food crops. About 20%. We talked about this…
- Resistance gene cloning from a wild crop relative by sequence capture and association genetics. A new way to reduce the above, using crop wild relatives.
- Adding color to a century‐old enigma: multi‐color chromosome identification unravels the autotriploid nature of saffron (Crocus sativus) as a hybrid of wild Crocus cartwrightianus cytotypes. Which means you can now re-synthesize it.
- Crop wild relative diversity and conservation planning in two isolated oceanic islands of a biodiversity hotspot (Mauritius and Rodrigues). Basically coffee.
- Diversity and conservation priorities of crop wild relatives in Mexico. Over 300 species, but not coffee.
- Benefit sharing mechanisms for agricultural genetic diversity use and on-farm conservation. Profit-sharing is better for conservation than technology transfer.
- Are Cocoa Farmers in Trinidad Happy? Exploring Factors Affecting their Happiness. Well, those whose main crop was not cacao are happier, which must say something.
- Edible fruits from Brazilian biodiversity: A review on their sensorial characteristics versus bioactivity as tool to select research. Eat Anacardium occidentale, Passiflora edulis and Acrocomia aculeata to be happiest. Seems very unadventurous, though.
- Genetic differentiation in leaf phenology among natural populations of Adansonia digitata L. follows climatic clines. Anyone going to do this for all those Brazilian fruits?
Spatial data roundup
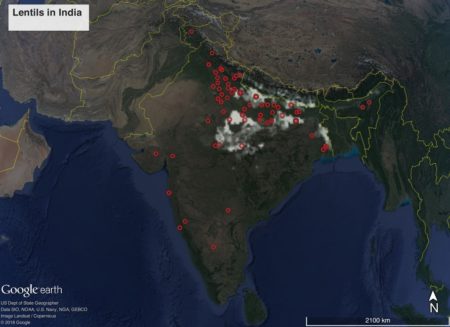
There’s a new version of the high-resolution global crop production dataset known as SPAM, using 2010 data. This is the third iteration, and we’ve blogged about previous versions before. Here’s what rainfed smallholder peanut area looks like in India, with germplasm from Genesys on top of it for good measure.
Might as well point to a few other spatial resources which have recently become available since I’m at it:
- Gridded Livestock of the World – Latest – 2010 (GLW 3)
- Global Aridity Index and Potential Evapotranspiration (ET0) Climate Database v2
- Travel time to cities and ports in the year 2015
I may play around with these too in the next weeks.
Nibbles: I say potato, CATIE genebank, Wat, Teff war, Digitizing collections, Black History Month, Crop stats
- Genebanks, crop wild relatives, friends, even a cool title — this one has it all: The New Potato.
- Latest on the CATIE seed collection.
- The wonder of Ethiopian food.
- Which I guess can include teff again now.
- Digitizing the Smithsonian — fast.
- George Washington Carver celebrated.
- Oh look, there’s a new version of SPAM. Let the GISsing begin.
Detecting Wisconsin’s Wild Cranberries from Space
This is a guest post by Vanesa Martin, Anastasia Kunz, Nicole Pepper and Eli Simonson of the NASA DEVELOP Colorado office. Many thanks to all of them. And thanks also to Colin Khoury for helping to make it happen.
NASA DEVELOP, as a part of NASA’s Applied Sciences Program, addresses environmental issues through interdisciplinary research projects that apply the lens of NASA Earth Observations to community concerns around the globe. Over the last year, researchers at the USDA ARS National Plant Germplasm System (NPGS) in Fort Collins, Colorado approached the NASA DEVELOP program to determine whether NASA satellites could be used to monitor and map Crop Wild Relatives (CWR) more efficiently than standard field methods alone. This collaboration has created a push to experiment with the mapping of different types of CWRs, in the hope of eventually producing an operational method to accurately monitor CWRs globally.
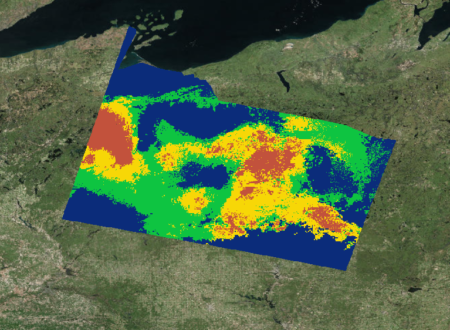
In the fall of 2018, our NASA DEVELOP team was formed to focus efforts on using satellite information to map the distributions of wild cranberries within a Landsat scene in northern Wisconsin. Previously, the USDA ARS’s method for mapping species distribution had exclusively considered bioclimatic and environmental factors, and these provided only a rough prediction of possible cranberry presence that looked like this:

With the aim of narrowing down the areas of predicted presence, the team used cranberry presence data from publicly available databases like GBIF and BISON to train initial habitat distribution models through Software for Assisted Habitat Modeling (SAHM). In addition to publicly available cranberry presence data, we incorporated bioclimatic and topographic variables derived from WorldClim (a global climate database with 1 km resolution) to mirror the current practices of USDA. We later incorporated ClimateNA data (a national climate database with 30m resolution) to assess whether our distribution maps improved.
The publicly available presence data we used was not suitable for remote sensing purposes, given that remote sensing requires highly accurate location information where the spectral signatures of the target species is clearly discernible. Consequently, we generated our own predicted presence points in order to incorporate spectral data and NASA Earth Observations into these models. These user-generated points, which we based on research we did of our two target cranberry species, were sent to our field cranberry experts to verify that they actually represented sites of probable cranberry presence.
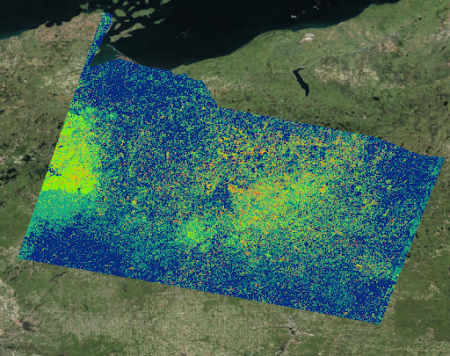
After getting their approval and employing the user-generated points, we incorporated spectral detection into the models, creating maps based on the detection of the spectral signature of these species instead of predicting their possible locations based on suitable environmental conditions. This was the result, with red being the likeliest locations of cranberry presence:

One way we assessed the accuracy of our detection method was by overlaying a commercial cranberry layer we obtained from the Wisconsin Department of Natural Resources on to our maps to see how well they aligned with our binary detection maps. The binary detection maps did indeed locate commercial cranberry crops, despite the fact that we did not use any commercial cranberry presence points to train our models. With this assurance in hand, we felt more confident in sending our final incorporated maps to our field partners and experts for a final verification.
We hope to be able to continue working with our partners to conduct in-field verification of our maps. For now, however, it’s apparent that spectral data can positively influence the research efforts of our partners at the USDA ARS, and their larger goals of improved food security and biodiversity.
