With Gabe on the trail of the wild banana

From the Facebook page of Banana Natural Biodiversity Mapping – Citizen Science, which I think we have blogged about before:

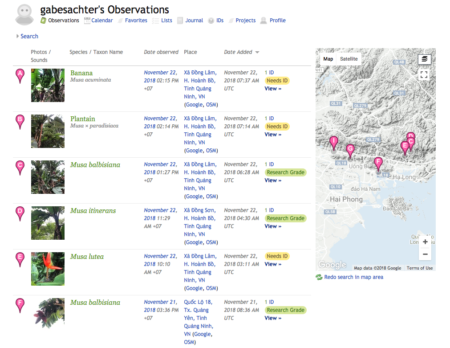
CIRAD and its partners are currently collecting Musa material in Vietnam, within the frame of the “BSV for Banana Diversity” project. As an expert to the project, Gabe Sachter-Smith has begun to post his observations to iNaturalist, including Musa balbisiana and many other endemic species. He then added the observations to our Banana Natural Diversity Mapping Project (http://bit.ly/MusaDivMapping). #BananaDivMapping #CitizenScience #iNaturalist #AddYours #ShareTheNews

Follow Gabe along as he explores banana diversity. He’s also on Instagram.

Almost like being there. Almost.
Brainfood: Climate resilient crops, Food system limits, Phenotyping double, Sweet sorghum, Melon history, Paying4data, Beercalypse, Village chickens, Breeding 4.0, European maize, Brachiaria ROI

Counting your chickens

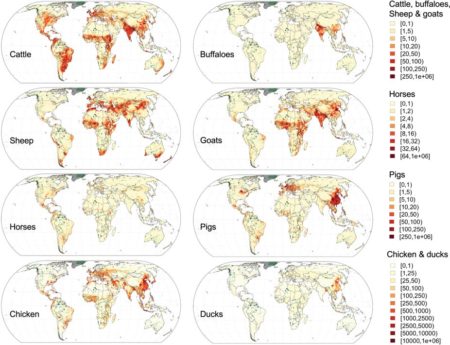
A new version is out of the FAO global livestock density datasets, which we have blogged about before. This is the third iteration (GLW3), and it has a reference year of 2010. There’s a paper to give you all the details. ((Gilbert. M. et al. Global distribution data for cattle, buffaloes, horses, sheep, goats, pigs, chickens and ducks in 2010. Sci. Data. 5:180227 doi: 10.1038/sdata.2018.227 (2018).))

But there’s more to come:

Future versions of GLW will differentiate stocks according to production systems for ruminant (meat vs. dairy) and monogastric species (intensive vs. extensive, meat vs. egg production). Higher resolution models ((The current global dataset has a resolution of 0.083333 decimal degrees, or 10 km at the equator.)) for individual countries where the census data can support such predictions will also be produced.

The datasets are also available for download from Harvard Dataverse.

Mapping crops, field by field

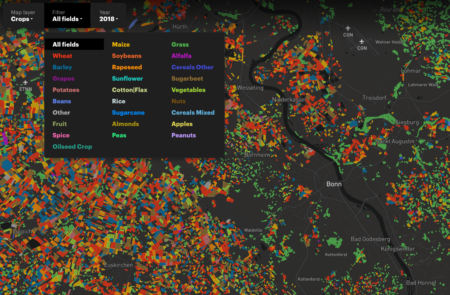
That’s what agriculture looks like around here, according to the Belarus-based ag-tech startup, OneSoil. According to the press release:

Today, OneSoil, a precision farming startup, announced the launch of a new map, the OneSoil Map, which it has developed to allow everyone in the agriculture industry to explore and compare fields and crops in Europe and the United States – 44 countries in total. The key feature of the map is that it allows users to see how these fields have changed over the past three years (2016 – 2018). To accomplish this, OneSoil combined public data from the European Copernicus Programme and Mapbox GL JS, the latter of which helped in visualizing large volumes of ag data. The metrics included on the map are hectarage, the crop, and country crop rating.

Still processing the enormity of it all.