The Southern Corn Leaf Blight epidemic that struck the US in 1970 is usually seen as a canonical example of the dangers of genetic uniformity. I use it that way myself, often. Certainly yield losses in 1970 seemed very high, higher than the average 12% “expected from all diseases of corn”. But could we all be wrong? A commenter thinks so.
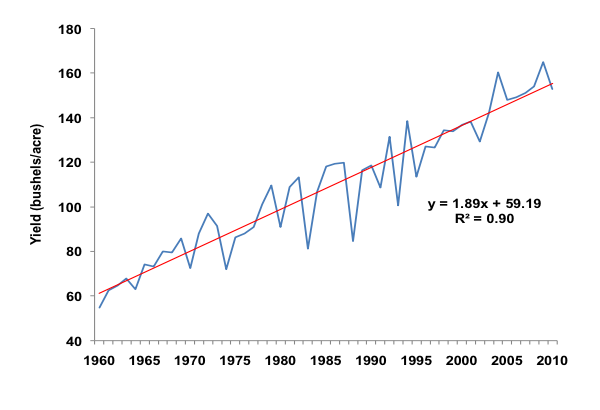
[W]as it a major problem? Over twenty years ago I gave a seminar at CIMMYT. I had prepared a slide showing the year on year average yield increase 1 in maize in the USA for about 70 years‚ but leaving off the actual years. … I challenged the audience to identify the blight year (1970). Nobody could. … Try this on colleagues and students.
I did, and it is true, 1970 does not look all that extraordinary against the trend.

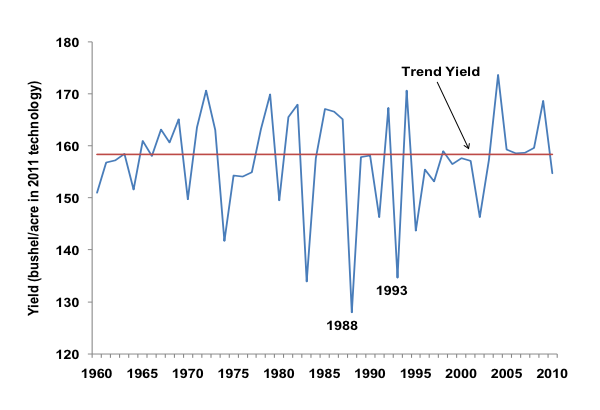
A more interesting graph is this one, in which the rising trend in average yield is removed from the actual yield each year.

Now 1970 is a little more visible, though I agree it still doesn’t look catastrophic. I mean, compare that with 1988 and 1993. There is one huge difference. In 1988 drought was widespread, while in 1993 floods devastated many farms and yields in the northwest corn belt. Weather in 1970 was just fine, thank you. Weather is clearly a very important factor in annual yields, and it interacts with pests and diseases in complex ways, but it seems pretty clear that the yield loss of 1970, while not as drastic as in other years, was certainly not the result of wayward weather.
The commenter asked “are we making too much of a fuss about the Leaf Blight”? I don’t think so, obviously, so I asked Professor Darrel Good, of the University of Illinois. He knows more about maize yields than almost anyone (and is responsible for the graphs above). He said:
I have not seen any specific analysis of 1970, but am pretty sure that the decline in corn yield was in fact attributed to the outbreak of southern corn leaf blight. Hard to quantify that impact relative to weather. It is a similar phenomenon as the aphid damage to the soybean crop of 2003. 2 These rare events are not captured in our models.
In some respects, pests and diseases are as unpredictable as weather. In industrialized agriculture, genetic diversity within a crop is unlikely to provide much protection against the vagaries of weather. 3 But genetic diversity definitely can protect against unpredictable pests and diseases, not just in maize, and not just against Southern Corn Blight.
Well, the aggregate yield of the US was perhaps not terribly affected by SCLB, but the yield of Florida certainly was:
http://dl.dropbox.com/u/18619554/FloridaMaizeYields.xlsx
The drop in 1970 in Florida was similar to that in 1977 and 1998. What might have caused low yields as those years? The more important question is why the next year, in 1971 everything was dandy again, both in Florida and the nation?
Resistant varieties that did not descend from the “Texas cytoplasm”? Apparently they may have been used on as much as half the acreage (now that’s what I call resilience!).
And better weather? Here is a nice account of the events. According to this source the weather was clearly implicated.
And then there is the hyperbole. Farm state politicians cry wolf. The National Academy of Sciences says that the corn plants of America had become as alike as identical twins.
Isn’t it remarkable that this is the only (well-known?) incident of this nature in recent history? And that it only was an incident that cannot even be detected on the yield charts? Are the levels of diversity that we are maintaining in the fields perhaps sufficient?
Thanks Robert. I agree we need to be more skeptical of these claims, and I also think that we need to be wary of the grand claims. I do think, though, that averaging over the whole country may be hiding some of the detail. The NAU account you link to, and other contemporary analyses, do give some indication of impact at smaller scales, and I think it is clear that there was an impact.
It would be interested to see a new analysis using the better tools available today.
As I’ve tried to argue elsewhere, what matters is not the overall genetic diversity in a crop, but the diversity for the alleles that matter, and in the case of T cytoplasm, that was almost zero.
The epidemic was real and damaging in some places, as the Florida data clearly show. But there is an “extrapolation fallacy”: despite clear problems in some places, the aggregate US productivity was not much affected.
Another case in point is the tremendous heatwave in much of the summer of 2011. The news-sites were full of photographs of fields with brown stunted and shriveled plants that died before they even flowered. The nation-wide productivity was probably lower because of it, but not by that much as your graph nicely shows.
True, but epidemics start somewhere and then build up, so extrapolation might be more warranted in the case of diseases than in the case of extreme weather.
All easily answerable questions, using the wonders of the Internet. This graph explains the other low yield years.
And yes, in 1972 everything was dandy again. As this article explains:
Perhaps they did make it look too easy!
Thanks Jacob. Eyeballing the data, 1970 definitely looks to be further below the trend line than any other year.
I had asked Good about state or even county data, and he didn’t have those. They must exist. I just don’t know my way around US ag stats all that well.
Yes, I got this from the USDA website. You can also get county level data.
Jeremy: Thanks for pursuing this – Jacob’s link to the graph showing the impact of drought startled me. With traditional agriculture we could expect more within-field genetic variation and, with seed saving, more of the resistant types in the next generation after a drought. But with several years between droughts, would this be reversed? A better strategy for farmers could be to maintain `pure’ lines of many different kinds and to plant these in identifiable plots. After disease or climatic stress the best performers could be singled out and used at a higher frequency, but seed could also be maintained from the lower performing plots in case selection pressure reversed. Over longer periods of time, the lower performers could be abandoned or maintained at low incidence by a few only of the members of the farming community. [As an aside, this would get over the problem of small-seeded plants being more fecund and masking the effects of environmental selection.] I’m glad I don’t have to earn my daily bread thinking this through.