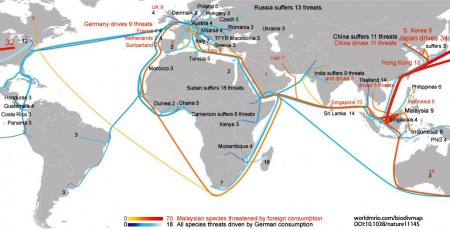
As Rio +20 looms ever nearer, everyone is scrambling to put stuff out pushing their particular agenda, taking care to note that they’re not suggesting that their agenda is any less vital than anyone else’s agenda, of course, and that in any case There Are No Silver Bullets. One of the more interesting products released to coincide with next week’s Brazilian festivities is an interactive map which uses “a new global trade database to follow the products implicated in species threats right through to the final consumers.”
The paper describing the methodology is in Nature.
We linked 25,000 Animalia species threat records from the IUCN Red List of endangered species to over 15,000 commodities produced in 187 countries. We then used the trade database to evaluate over 5 billion supply chains in terms of their biodiversity impacts.
It’s a massive undertaking, and it may be churlish to wonders why it’s not easier to export the maps it enables one to produce. So I won’t, and merely confine myself to hoping that a plant version will be available soon. Oh, and maybe also one in which agriculture is not seen only as the bad guy. In fact, would it not be nice to have the other side of the coin? That is, a map showing where supply chains may actually be contributing to conservation. Come on, there must be a few examples of that! Bird-friendly coffee, anyone?
