There’s a follow-up to that Environment Reports website on farm size and nutrient production that we blogged about a couple of weeks back. The data come mainly (though not exclusively) from a blockbuster inaugural Lancet Planetary Health article.
The new website explores farm size variation among different regions of the world through some great imagery. But it also highlights one aspect of the paper that I didn’t mention in the previous post: crop diversity on farm. Here’s the relevant figure (the paper’s figure 5), mapping how many different types of crops are produced in a pixel and how evenly these different types are distributed (the Shannon diversity index, H).
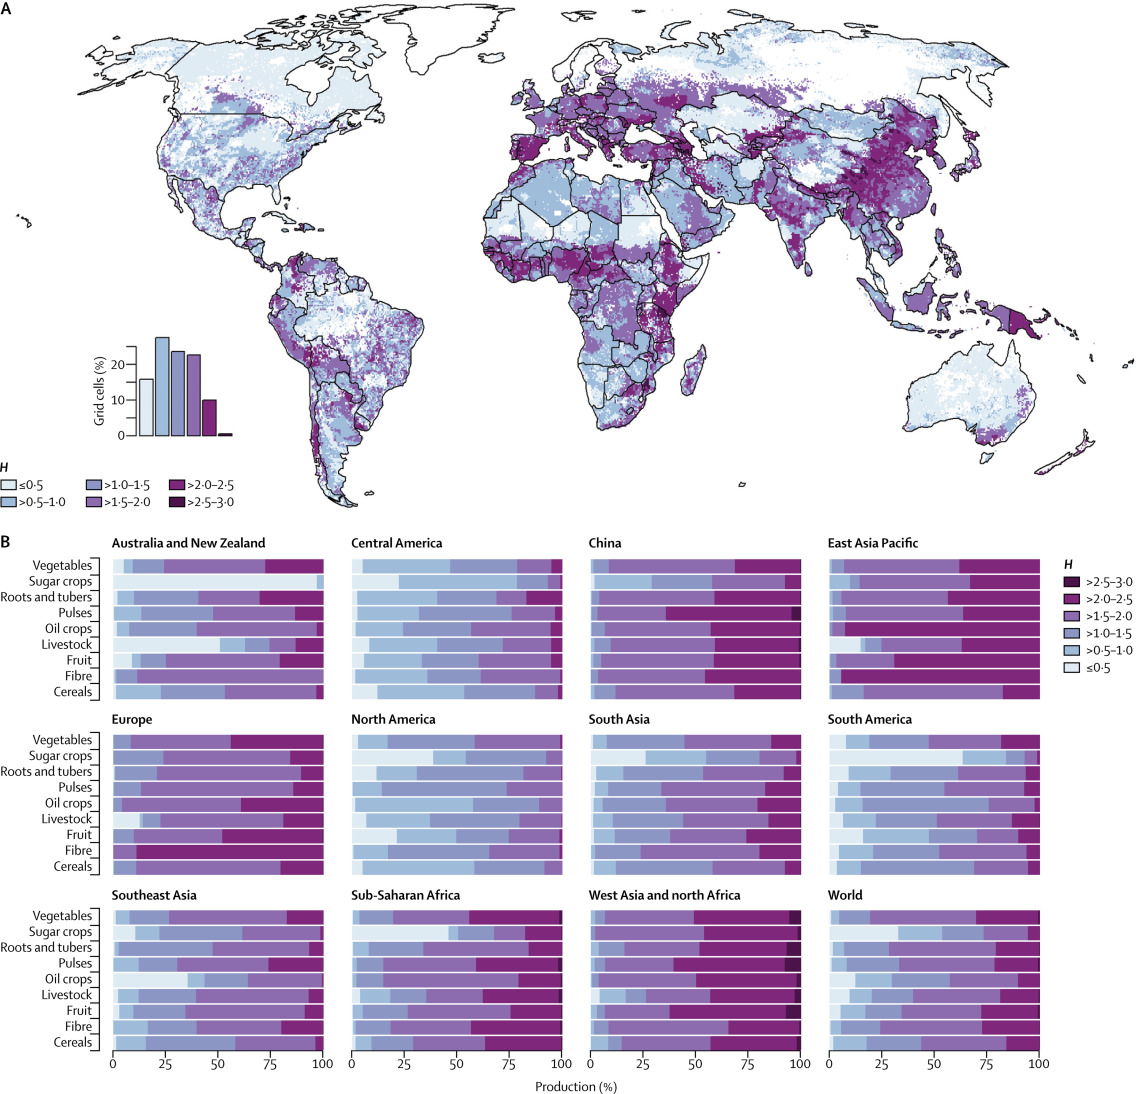
Here’s what the authors have to say about diversity and nutrient production (my emphasis).
…combining the diversity measures with spatially explicit plot sizes, which are highly correlated with farm size, shows that agricultural diversity (H) decreases as plot size increases (p<0·0001; appendix). In particular, areas with small and medium farms (≤50 ha) have larger diversity than do larger scale farms. These differences also translate into differences in nutrient production (figure 6). On a global level, areas with higher diversity of food commodities (higher H) produce more micronutrients than do areas with less diversity. This effect is particularly noticeable in places such as China, sub-Saharan Africa, east Asia Pacific, and west Asia and north Africa. In contrast with North America, in Europe, although production comes mostly from medium and large farms, it is not farm size, but the diversity of production that drives nutrient production in this region.
Do you have any book reference?