This is a guest post by Vanesa Martin, Anastasia Kunz, Nicole Pepper and Eli Simonson of the NASA DEVELOP Colorado office. Many thanks to all of them. And thanks also to Colin Khoury for helping to make it happen.
NASA DEVELOP, as a part of NASA’s Applied Sciences Program, addresses environmental issues through interdisciplinary research projects that apply the lens of NASA Earth Observations to community concerns around the globe. Over the last year, researchers at the USDA ARS National Plant Germplasm System (NPGS) in Fort Collins, Colorado approached the NASA DEVELOP program to determine whether NASA satellites could be used to monitor and map Crop Wild Relatives (CWR) more efficiently than standard field methods alone. This collaboration has created a push to experiment with the mapping of different types of CWRs, in the hope of eventually producing an operational method to accurately monitor CWRs globally.
In the fall of 2018, our NASA DEVELOP team was formed to focus efforts on using satellite information to map the distributions of wild cranberries within a Landsat scene in northern Wisconsin. Previously, the USDA ARS’s method for mapping species distribution had exclusively considered bioclimatic and environmental factors, and these provided only a rough prediction of possible cranberry presence that looked like this:
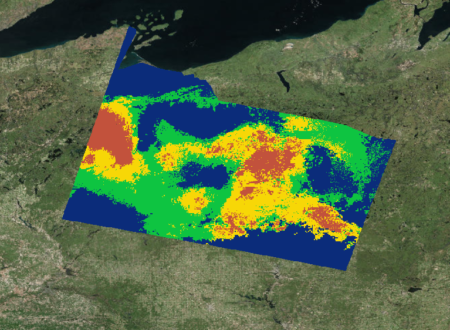
With the aim of narrowing down the areas of predicted presence, the team used cranberry presence data from publicly available databases like GBIF and BISON to train initial habitat distribution models through Software for Assisted Habitat Modeling (SAHM). In addition to publicly available cranberry presence data, we incorporated bioclimatic and topographic variables derived from WorldClim (a global climate database with 1 km resolution) to mirror the current practices of USDA. We later incorporated ClimateNA data (a national climate database with 30m resolution) to assess whether our distribution maps improved.
The publicly available presence data we used was not suitable for remote sensing purposes, given that remote sensing requires highly accurate location information where the spectral signatures of the target species is clearly discernible. Consequently, we generated our own predicted presence points in order to incorporate spectral data and NASA Earth Observations into these models. These user-generated points, which we based on research we did of our two target cranberry species, were sent to our field cranberry experts to verify that they actually represented sites of probable cranberry presence.
After getting their approval and employing the user-generated points, we incorporated spectral detection into the models, creating maps based on the detection of the spectral signature of these species instead of predicting their possible locations based on suitable environmental conditions. This was the result, with red being the likeliest locations of cranberry presence:
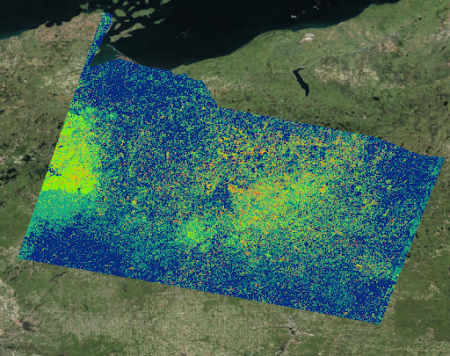
One way we assessed the accuracy of our detection method was by overlaying a commercial cranberry layer we obtained from the Wisconsin Department of Natural Resources on to our maps to see how well they aligned with our binary detection maps. The binary detection maps did indeed locate commercial cranberry crops, despite the fact that we did not use any commercial cranberry presence points to train our models. With this assurance in hand, we felt more confident in sending our final incorporated maps to our field partners and experts for a final verification.
We hope to be able to continue working with our partners to conduct in-field verification of our maps. For now, however, it’s apparent that spectral data can positively influence the research efforts of our partners at the USDA ARS, and their larger goals of improved food security and biodiversity.
Amazing…What an incredible project. You must be so very proud of your team!