A recent Nibble pointed to an image of new, updated map of the expansion of agriculture in Europe. As is usually the case when I see almost any map, I immediately started to think about mashing it up with the localities of genebank accessions. Downloading barley landrace data from Genesys and importing it into Google Earth was easy. And you can also import an image into Google Earth, so it is theoretically possible to superimpose accessions on spread of agriculture.
Unfortunately, the practice is not straightforward, because you have to distort the image by hand to fit neatly on top of the map in Google Earth, and that can take a while. I gave up after about an hour, and after some googling eventually found Map Warper, which does the distortion for you for free. Importing the warped map into Google Maps resulted in a perfect fit.
So here’s the result.
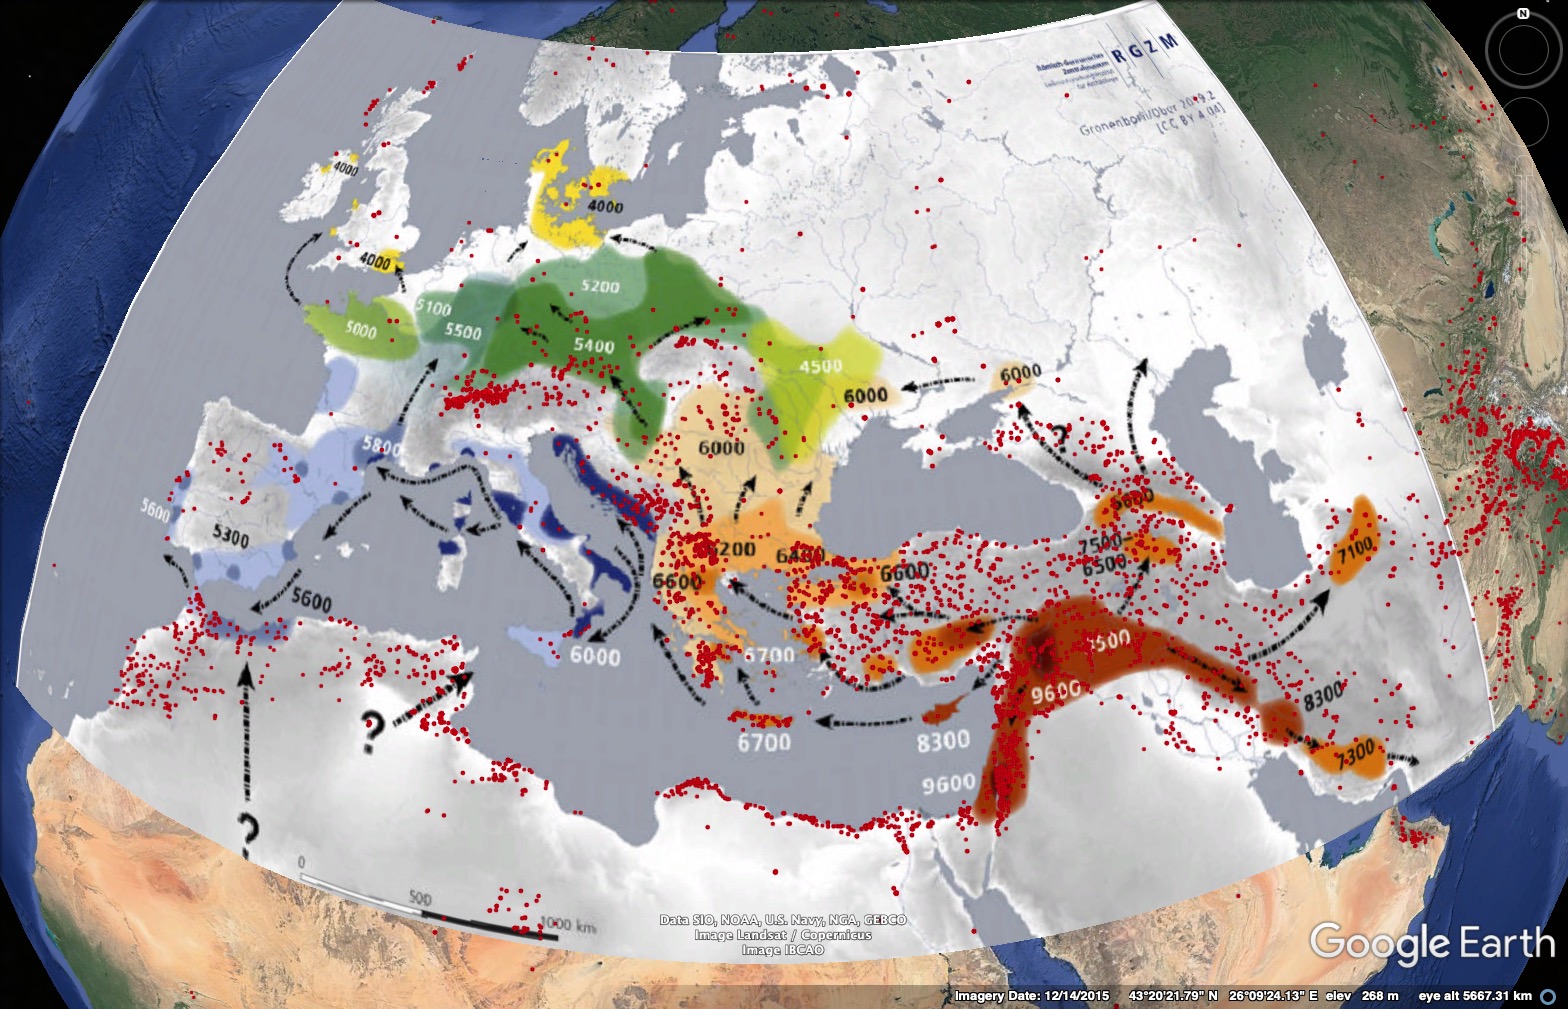
It looks like there are barley landrace accessions from most of the areas highlighted, with dates, in the spread of agriculture map, though they are by no means all equally covered. At least as far as Genesys knows. There have of course been a number of studies looking at the geographic pattern of distribution of genetic diversity in barley in and around Europe. As far as remember, none of them explicitly took into account how long the crop had been in different places. But the material could be available for such a study to be done.
5 Replies to “The spread of agriculture in Europe, genebank edition”