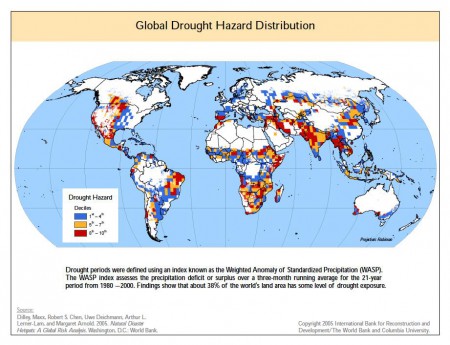
Just a quick follow-up to the rhyming couplet on water-related stresses in the just-published Brainfood. The Center for Hazards and Risks Research (CHRR) at Columbia University, which we have mentioned here before in connection with tsunami risk, also has data on Global Drought Hazard Distribution.
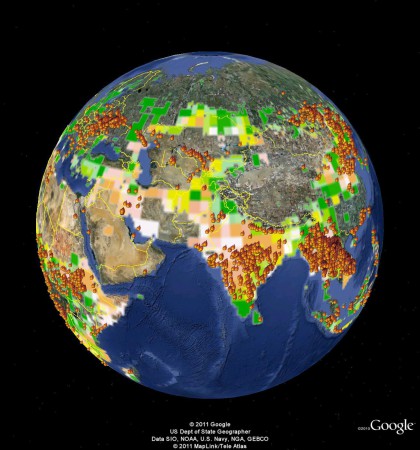
With a little R-related effort by Robert ((Ok, ok, I’m installing it!)) you can get a Google Earth file, which looks like this for Asia. ((I know, the colours are a bit funny. But basically, orange and cream are bad. Working on that.)) I’ve also added MODIS fire hotspots for the past 24 hours, merely because I can. That would be the little fire icons.
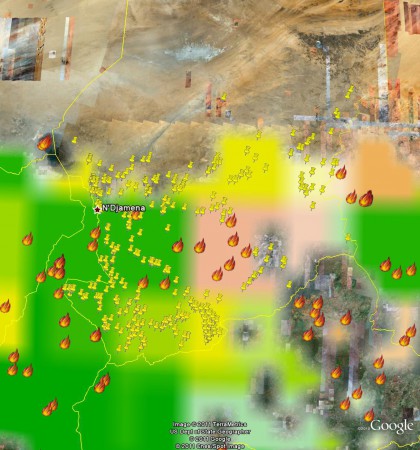
And that means you can mash up drought risk with germplasm origin (from Genesys, say), in this case from Chad as an example.
Which is a great thing to be able to do because as we have just had reconfirmed by our friend Dag Endresen, the origin of germplasm allows you to make some predictions about its performance.


