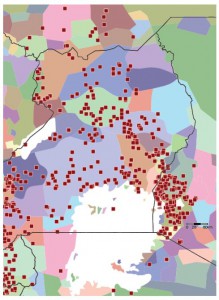
Ever since I contributed to A methodological model for ecogeographic surveys of crops, and suggested that collectors should do this, I’ve been waiting for the time when it would be easy — or even possible — to map the distribution of conserved germplasm on top of cultural, ethnic or language boundaries. The problem has been that maps of such boundaries, 1 though available in various printed formats, have not been much digitized. Or at least I hadn’t come across them. Until I happened on a blog post about the Center for Geographic Analysis’ (Harvard University) WorldMap, an open source web mapping system. The layers provided include one called Ethnicity Felix 2001, which “consist of polygons and labels depicting ethnicity information based on the ‘People’s Atlas of Africa’ by Marc Felix and Charles Meur, Copyright 2001.” Perfect, I thought.

Nice! That’s a really interesting map. Identification of cultural gaps in germplasm collections sounds like something that deserves some attention. I wish there was a way to identify the accessions (basic passport data) like one can do for the ethnic groups by using the “identify” function. –is there?