![]() Let us assume, for the sake of argument, that one crop variety does disappear every single day. The question still remains: does it matter? After all, the variety that was just lost yesterday might be very similar to one that’s still out there today. That’s part of the reason why a group of French researchers has just come up with “A new integrative indicator to assess crop genetic diversity,” which is the title of their paper in Ecological Indicators. ((Bonneuil, C., Goffaux, R., Bonnin, I., Montalent, P., Hamon, C., Balfourier, F., & Goldringer, I. (2012). A new integrative indicator to assess crop genetic diversity Ecological Indicators, 23, 280-289 DOI: 10.1016/j.ecolind.2012.04.002))
Let us assume, for the sake of argument, that one crop variety does disappear every single day. The question still remains: does it matter? After all, the variety that was just lost yesterday might be very similar to one that’s still out there today. That’s part of the reason why a group of French researchers has just come up with “A new integrative indicator to assess crop genetic diversity,” which is the title of their paper in Ecological Indicators. ((Bonneuil, C., Goffaux, R., Bonnin, I., Montalent, P., Hamon, C., Balfourier, F., & Goldringer, I. (2012). A new integrative indicator to assess crop genetic diversity Ecological Indicators, 23, 280-289 DOI: 10.1016/j.ecolind.2012.04.002))
Christophe Bonneuil and his co-workers thought that, given the data, they could come up with something more powerful and more widely applicable than richness (i.e. the number of different varieties) or the standard diversity indicators (i.e. various combinations of richness and evenness). So they started with number of varieties, but then they factored in the relative extent to which each was grown in their study area, the departement of Eure-et-Loire in France (which is the evenness bit), how genetically distinct each was (which is the bit which addresses the pesky question of how different the variety that disapeared today is from all the other ones left behind), and how much genetic diversity there was inside each.
They got the data on genetic differences among varieties by comparing genebank samples of all the wheat types grown in Eure-et-Loire from 1878 and 2006 at 35 microsatellite loci, and data on acreage of each variety at different points in time from various archival sources. Internal genetic diversity was set at one of three values derived from the literature, depending on whether the variety was a landrace, an old commercial line or a modern pure line.
They put all that together into this monster indicator of allelic diversity in the landscape,

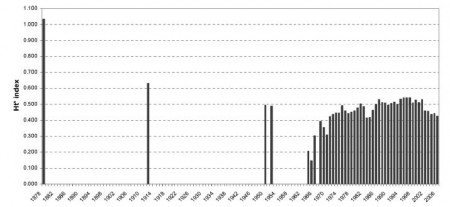
and then calculated it for different times periods, and got this:
That shows a decrease in diversity as landraces are replaced with modern varieties, but, interestingly, something of a resurgence after the mid-1960s, as more diverse germplasm is introduced into breeding programmes. The indicator has been on a downward trend just lately, as the genetic relatedness of the most frequent varieties has increased. ((A result that you might like to compare with the one we discussed not so long ago for the diversity in modern breeding programmes.)) Overall, it’s maybe a 50% drop since 1878. Not entirely dissimilar to the iconic 75% figure, and at least this wasn’t plucked out of thin air.
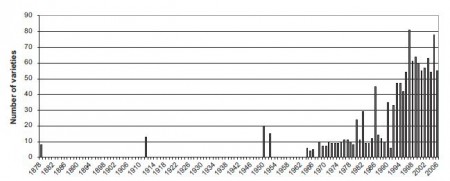
Interesting enough, but check out the trend in number of varieties over the same period:
Totally different. Pretty much an upward trend, albeit with some stuttering. Certainly no evidence from these data of massive erosion of diversity. Maybe the findings of Jarvis et al. (2008) that simple richness can be a useful indicator of diversity should be applied with caution if you’re not just dealing with landraces.
But how significant is it really that the value of this particular indicator of diversity, for all its fanciness, has decreased? Has anyone actually suffered as a result? I don’t know, but a second paper I came across this week suggests how one could find out. Roseline Remans and others associated with the Millennium Villages Project have a study out in PLoS ONE which adds yet another — different — nuance to diversity. ((Remans, R., Flynn, D., DeClerck, F., Diru, W., Fanzo, J., Gaynor, K., Lambrecht, I., Mudiope, J., Mutuo, P., Nkhoma, P., Siriri, D., Sullivan, C., & Palm, C. (2011). Assessing Nutritional Diversity of Cropping Systems in African Villages PLoS ONE, 6 (6) DOI: 10.1371/journal.pone.0021235)) Their index considers not just how many different crops are grown on a farm, but also how different they are in their nutritional composition. Think of it as the nutritional analogue of the inter-varietal genetic diversity term in the French indicator. The more different in nutritional composition two crops are, the more complementary they are to local diets, the more important it is that both are there, the higher the resulting “functional” diversity index. And in fact the authors did find a positive relationship between their diversity indicator and nutritional status, at least at the village level.
Easy to imagine (though perhaps less easy to actually implement) a further refinement of Bonneuil et al.’s indicator which additionally integrates nutritional data, to yield an indicator of crop genetic and functional diversity. And, of course, once you have such a super-indicator, it might actually be possible to reward people on the basis of their success in maintaining it at high levels. Which, as it happens, is the subject of yet another paper I happened across last week. ((Hasund, K. (2013). Indicator-based agri-environmental payments: A payment-by-result model for public goods with a Swedish application Land Use Policy, 30 (1), 223-233 DOI: 10.1016/j.landusepol.2012.03.011)) But maybe that’s a paper too far for now. ((And yes, you do remember these papers from Brainfood. It’s just that it sometimes takes a day or two for us to tease out the connections.))


The term “variety” can stand for “cultivar” or be short for “botanical variety”. The Vavilov-school assesses diversity by categorizing genepools into infraspecific groups and on the lowest level is usually the botanical variety. This approach has been used to describe the loss of diversity in bread wheat in Germany: Around 1885 there were twenty botanical varieties cultivated, in 1942 nine botanical varieties, in 1959 six botanical varieties and in 1970 two botanical varieties with T. aestivum var. lutescens dominating (See Chapter 11: Fallstudie Weizen. In: http://www.agrobiodiversitaet.net/site/page/downloads/downloads.php).
Some classical concepts may have value as indicators.